
Figure 6.
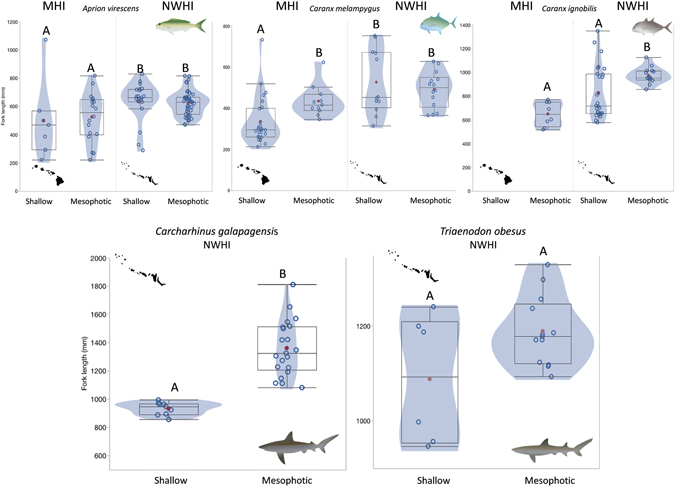
Box and whisker plots indicating fork-length size distributions for Aprion virescens, Caranx melampygus, Caranx ignobilis, Carcharhins galapagensis, and Triaenodon obesus. Whiskers indicate minimum and maximum values, the box specifies the lower interquartile range, and the solid black line indicates the median. Columns with the same letter are not significantly different (P > 0.05). Empty blue circles = individual fork-lengths, solid red circles = mean, shaded contour = density of measurements by length. Box and whisker plots generated in JMP statistical software, version 12.1.0 (http://www.jmp.com/). Maps in the figure were generated using Adobe Illustrator CS5 (https://www.adobe.com/products/illustrator.html).