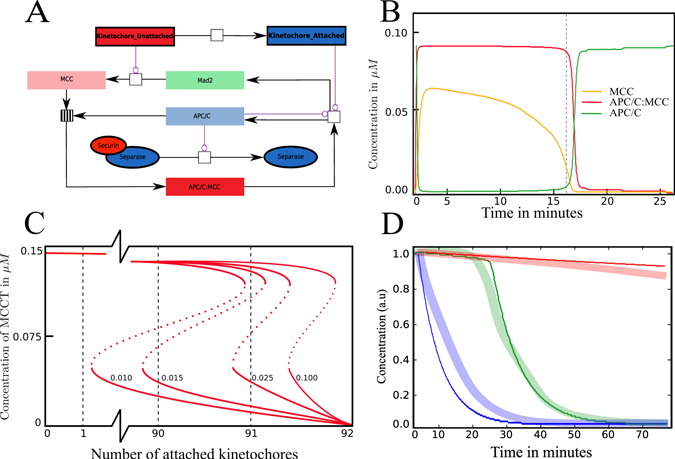
Figure 6.

Switch analysis performed using the minimal model. (A) Reaction network for the crucial switching part (following the labeling conventions Fig. 2). (B) The concentration plot for core species over time showing the switch occurring after proper spindle attachment (dashed line, cf. Fig. 3). (C) One-parameter bifurcation diagrams showing the activity of the MCC against the number of attached kinetochores using different rates k M1 (labeled next to the curves). With a properly chosen rate, the dashed red lines clearly show that all kinetochores have to be attached to completely silence the MCC. To reengage the SAC, kinetochores have to reattach. If the rate drops below the estimated threshold, the SAC is silenced before all kinetochores are attached. (D) Securin concentration under different treatments for in-vitro (thick lines) and in-silico (thin lines). The green curve shows the wild-type, blue shows the influence of Mad2 targeting siRNA and red shows the influence of nocodazole. In all situations, securin degrades steadily, validating the rheostat switch hypothesis.
