Figure 1.

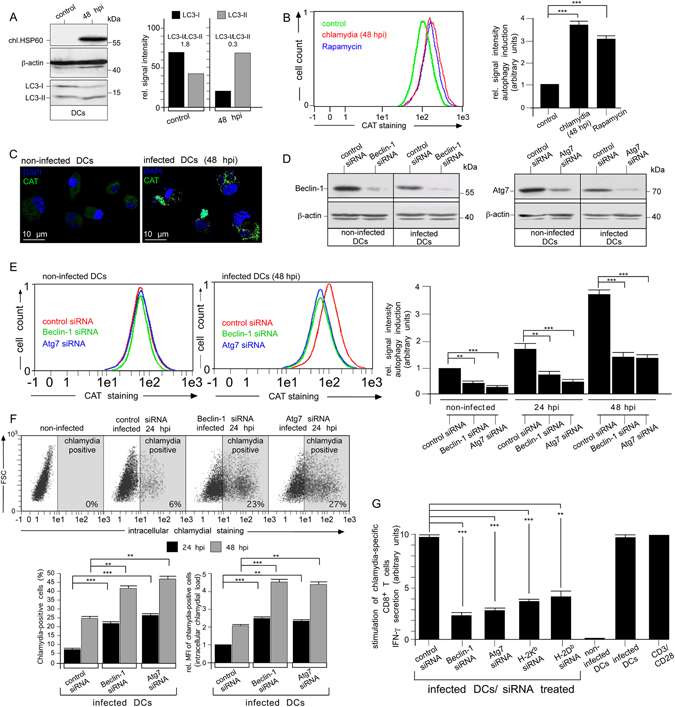
Enhanced autophagy in chlamydia-infected DCs is critical for intracellular degradation and MHC I-presentation of bacteria. (A) Chlamydia-infected DCs were analysed in Western blots using antibodies against chlamydial (chl.) HSP60, LC3, and β-actin (left). The LC3-I:LC3-II ratio was determined by densitometric scanning (right panel). (B,C) Autophagosome formation in DCs was analysed using CytoID labelling (fluorescent cationic amphiphilic tracer CAT) monitored with flow cytometry (left and right, Rapamycin was used as autophagy inducer) (B) or fluorescence microscopy (CAT is shown in green, DAPI in blue) (C). (D) Western blot analysis of infected (48 hpi) and non-infected DCs silenced for Beclin-1 and Atg7. (E) Beclin-1- and Atg7-silenced DCs as well as control cells were infected or not and analysed by CytoID staining. The left and middle panel show representative flow cytometry experiments of non-infected and infected (48 hpi) DCs. Data from three independent experiments (non-infected, 24 and 48 hpi) are summarised as bar graphs with arbitrary units (right). Data in (B and E) were normalised such that the value obtained for non-infected cells (control siRNA in (E) was set to 1. (F) Beclin-1- and Atg7-silenced DCs were infected or not with chlamydia and analysed by flow cytometry using the IMAGEN kit. The upper panel shows a representative analysis at 24 hpi. Data from three independent experiments (24 and 48 hpi) are summarised in bar graphs (lower panel). The number of chlamydia-positive cells was measured, as well as the bacterial load (MFI) of infected cells. MFIs obtained for infected cells (24 hpi) were set to 1 arbitrary unit. (G) DCs were siRNA-silenced for Beclin-1 and Atg7, MHC I (H-2Kb and H-2Db) and then infected with chlamydia. AllStars siRNA, non-infected cells and anti-CD3/CD28-beads were used in control experiments. DCs were cocultured with chlamydia-sensitised CD8+ T cells. IFN-γ secreted by CD8+ T cells was assayed by ELISA. Relative values of IFN-γ secretion are expressed in arbitrary units (maximum value was set to 10) and are means ± SD of three independent experiments. Statistical analysis in (B,E,F,G) was performed as described in Methods (**p < 0.01; ***p < 0.001 versus controls; n = 3).
