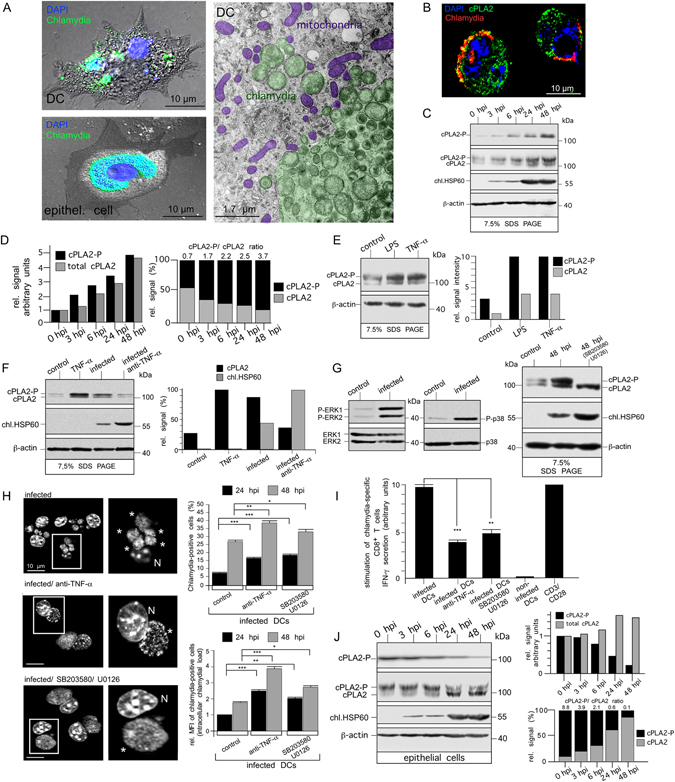
Figure 2.

Chlamydial infection of DCs is accompanied by induced expression and activation of AA-producing cPLA2. (A) Immunofluorescence of infected DCs (JAWSII) and epithelial cells (MN-R) (48 hpi) (left) stained for chlamydial LPS (green) overlaid on phase-contrast images. Host DNA and intracellular chlamydiae are visualised with DAPI (blue). Electron micrographs of infected DCs (right). Chlamydiae and mitochondria are artificially coloured. (B) Immunofluorescence of infected DCs costained for cPLA2 (green) and chlamydial LPS (red) (blue, DAPI). (C,D) Western blot of DCs infected for 0, 3, 6, 24, or 48 h using antibodies against phospho-cPLA2 (cPLA2-P), total cPLA2, chl.HSP60, and β-actin (C). cPLA2-P migrates more slowly on 7.5% SDS-gels than cPLA2. cPLA2 levels and cPLA2-P:cPLA2 ratios were determined by densitometric scanning (D). (E) Western blot of DCs treated with LPS (10 µg/ml) or TNF-α (30 ng/ml) for 48 h using antibodies against cPLA2 and β-actin. cPLA2-P and cPLA2 levels were determined by densitometric scanning (D). (F) Western blot of infected DCs treated with TNF-α-neutralizing antibodies using cPLA2, chl.HSP60, and β-actin-specific reagents (left). Quantification by densitometric scanning (right). (G) Western blot of infected DCs (12 hpi) using antibodies against phospho-ERK1/2 (P-ERK1/2), total ERK1/2, phospho-p38 (P-p38), and total p38 (left). Western blot of infected DCs treated with ERK1/2 (U0126)- and p38 (SB203580)-specific inhibitors using antibodies against cPLA2, chl.HSP60, and β-actin (right). (H) Microscopy of DAPI-stained infected DCs treated with TNF-α-neutralizing antibodies or MAPK inhibitors. Inclusions and disintegrated chlamydial structures are indicated by asterisks (left). Flow cytometry of such treated cells using the IMAGEN kit. Data from three independent experiments (24 and 48 hpi) are summarised in bar graphs as in Fig. 1F (right). (I) IFN-γ secretion by chlamydia-specific CD8+ T cells stimulated with infected DCs treated with anti-TNF-α or MAPK inhibitors. Results are depicted as in Fig. 1G. (J) Western blot of epithelial cells infected for 0, 3, 6, 24, or 48 h using antibodies against cPLA2-P, total cPLA2, chl.HSP60, and β-actin (left). cPLA2 levels and cPLA2-P:cPLA2 ratios were determined by densitometric scanning (right). Statistical analysis in (H and I) was performed as described in Methods (*p < 0.05; **p < 0.01; ***p < 0.001 versus controls; n = 3).
