Figure 4.

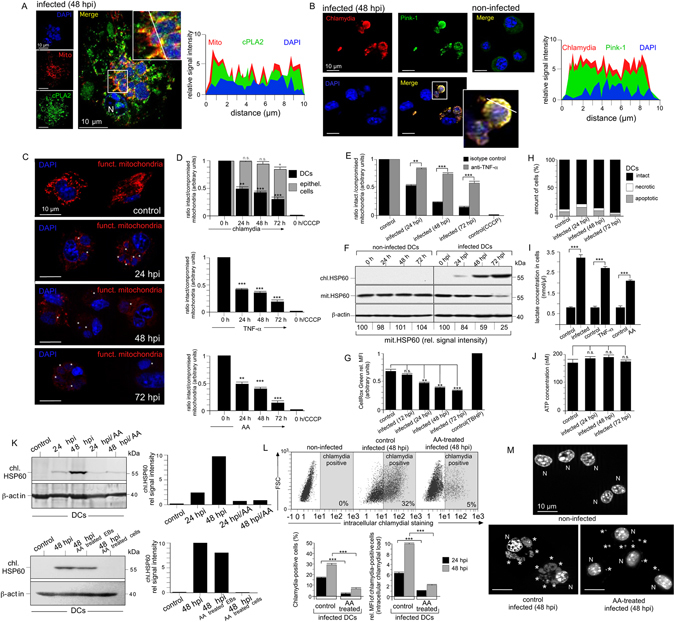
Functional role of AA and metabolic switch in the anti-chlamydial defence of infected DCs. (A,B) Immunofluorescence of infected DCs stained for cPLA2 (green) and mitotracker (red) (A), or Pink-1 (green) and chlamydia (red) (B). DNA is visualised with DAPI (blue). Fluorescence intensity along cellular cross sections was measured (ImageJ). Obtained profiles were overlaid and coloured. (C) Fluorescence microscopy of infected DCs stained with mitotracker (red) and DAPI (blue). (D) DCs (infected (top), treated with TNF-α (middle) or AA (bottom) were loaded with JC-1 and analysed by flow cytometry. The ratio of JC-1 oligomers (intact mitochondria) to JC-1 monomers (compromised mitochondria) is shown as bar diagram. CCCP-treated cells were used as control. (E) DCs were pretreated with neutralizing TNF-α antibodies and analysed as in Fig. 4D. (F) Western blot of infected and non-infected DCs using antibodies against chl.HSP60, mit.HSP60, and β-actin. (G) ROS production of infected DCs was measured by cellROX green using flow cytometry. TBHP-treated cells were used as control. (H) Infected DCs stained with Annexin V-FITC and propidium iodide were analysed by flow cytometry. (I) Infected, TNF-α- or AA-treated (100 µM) DCs were cultured for 48 h and cellular lactate was determined. (J) ATP levels were measured. In Fig. 4D, (E and G) data are expressed in arbitrary units as mean ± SD for three individual experiments. Maximum values were set to 1. (K) Western blot of infected DCs treated with AA 6 hpi before culture for 24 or 48 h. Antibodies against chl.HSP60 and β-actin were used (upper left). A similar experiment with cells and EBs pre-treated with AA (8 h) was also performed (lower left). Quantification by densitometric scanning (right). (L) Flow cytometry of infected DCs treated with AA as in Fig. 4K. Data from three independent experiments (24, 48 hpi) are summarised in bar graphs as in Fig. 1F (bottom). (M) Microscopy of DAPI-stained infected DCs treated with AA as in Fig. 4K. Chlamydial structures are indicated by asterisks. Statistical analysis in (D,E,G,I,J and L) was performed as described in Methods (n.s.: not significant; *p < 0.05; **p < 0.01; ***p < 0.001 versus controls; n = 3).
