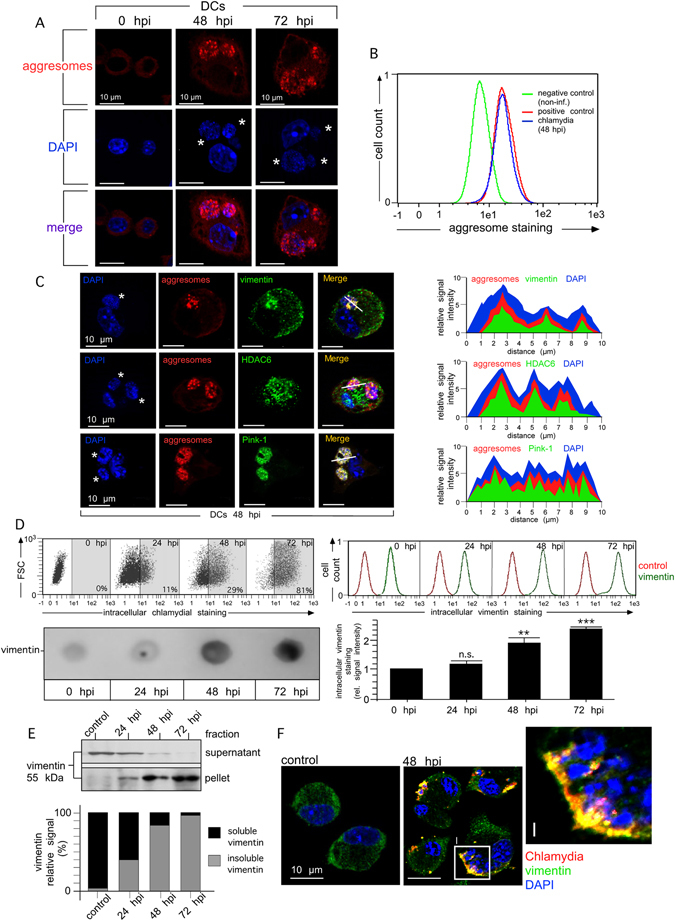
Figure 5.

Disintegration of inclusions in DCs is accompanied by vimentin aggregation and aggresome formation around bacterial structures. (A) Aggresome formation in DCs (red) was analysed by using the Proteostat aggresome detection kit. DNA was visualised by DAPI (blue). Chlamydial structures are indicated by asterisks. (B) For aggresome detection by flow cytometry, DCs were infected or not with chlamydia. Positive control cells were treated with MG-132 for 18 h. Fluorescence profiles of positive control cells, infected and non-infected DCs (48 hpi) were overlaid. (C) Infected DCs (48 hpi) were costained for vimentin, HDAC6, Pink-1 (green) and aggresomal structures (red). DNA was visualised by DAPI (blue). The fluorescence intensity along a cellular cross section of interest was measured. Obtained profiles were overlaid and coloured. (D) Infected DCs were incubated with IMAGEN kit (upper left panel) or anti-vimentin antibody (upper right panel). Intracellular stainings are depicted as flow cytometry dot plot (upper left panel) and histogram (upper right panel), respectively. Data from the vimentin-staining experiment are summarised by bar graph (lower right panel). The MFI values of non-infected cells (0 hpi) were set to 1 arbitrary unit. A corresponding immuno-dot blot analysis of urea-extracted DCs is depicted in the lower left panel. (E) For the analysis of vimentin aggregation, infected DCs were lysed and centrifuged. Pellet and supernatant were analysed for the presence of vimentin in the same Western blot. The signal distribution (%) between soluble and insoluble vimentin was determined by densitometry (bottom panel). (F) DCs were infected or not for 48 h and costained for vimentin (green), chlamydial LPS (red) and DNA (blue). Statistical analysis in (D) was performed as described in Methods (n.s.: not significant; **p < 0.01; ***p < 0.001 versus controls; n = 3).
