
Figure 9.
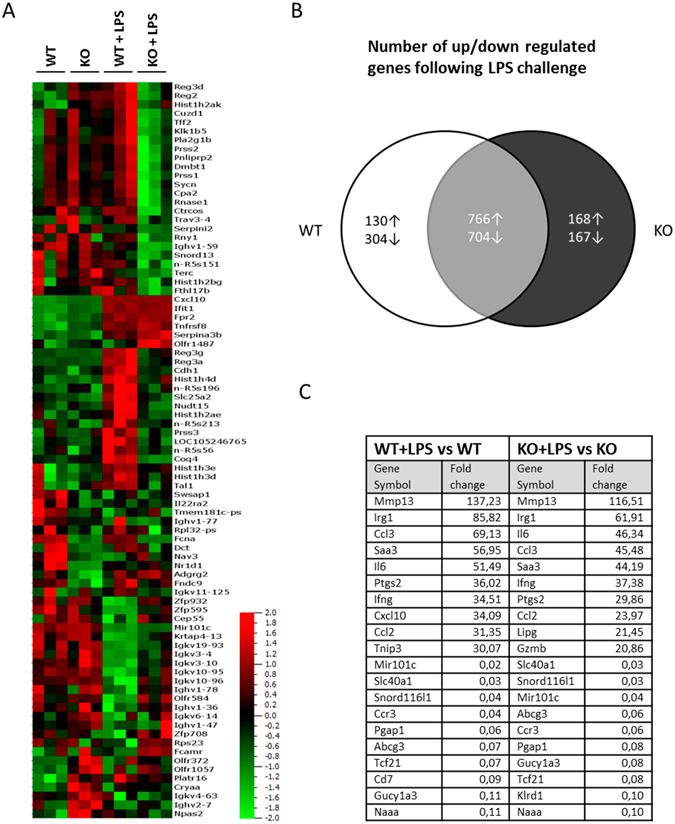
Microarray analysis of differentially expressed genes in WT and ficolin KO mice after LPS challenge. Groups of WT and ficolin KO mice were untreated or intraperitoneally injected with LPS of a lethal dose (10 mg/kg) and sacrificed after 6 h (n = 3 mice per group). Total RNA extracted from spleens was hybridized to the Affymetrix GeneChip Mouse Genome 2.0 ST arrays chip. (A) Heatmap showing all experimental samples and 85 genes found as differentially expressed between WT and KO mice in either naive or LPS-challenged state (cut-off: fold-change > 1.5 and p < 0.05). Samples are ordered by the four experimental groups and variables order by hierarchical clustering. (B) Venn diagram showing the number of differentially expressed genes induced by LPS challenge (cut-off: fold-change > 2.0 and q < 0.05). The white area contains the number of genes that were only affected in WT mice upon LPS challenge; the black area contains the number of genes that were only affected in ficolin KO mice upon LPS challenge; the grey area contains the number of overlapping genes between WT and ficolin KO mice that were affected upon LPS challenge. (C) Table showing the top 20 most changed genes (10 up and 10 downregulated) after LPS challenge in WT and ficolin KO mice (cut-off: fold-change > 2.0 and q < 0.05).