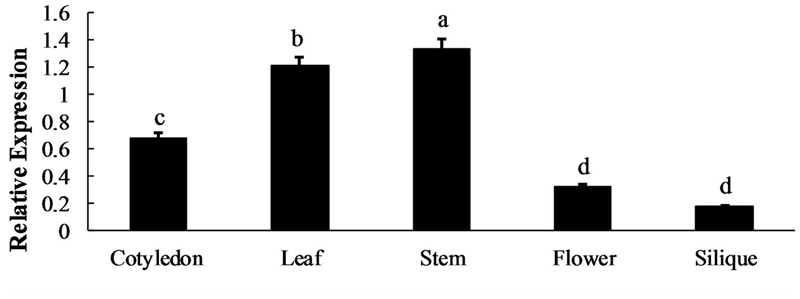
FIGURE 2.

Spatial expression patterns of BoaMYB28. The tissues are defied as: cotyledon (7 days), leaf (15 days), stem (30 days), flower (anthesis), and silique (15 days post-anthesis). The data were analyzed using a one-way analysis of variance. β-actin mRNA expression was detected as the internal control. The same letters indicate no significant differences, while different letters indicate a statistically significant difference in expression. Each bar represents the mean (± standard error) of three independent biological replicates.
