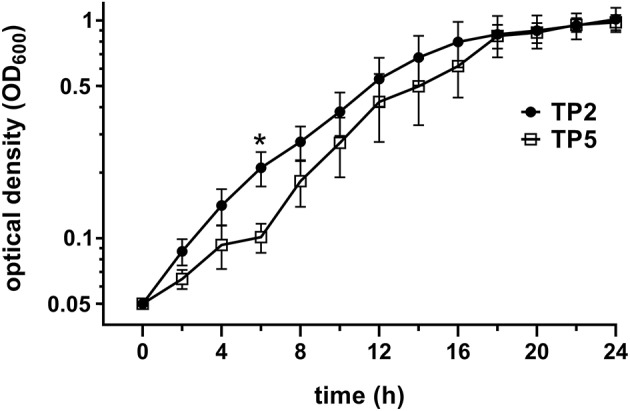
Figure 1.

Comparison of standard growth curves of TP2 and TP5. Standard growth curves were generated by measuring OD600 by spectrophotometer every 2 h for 24 h. Data are presented as mean ± SEM of OD600 readings for 5 different inocula for each strain. Asterisk indicates a significant difference (P < 0.05) between the two strains at that time point.
