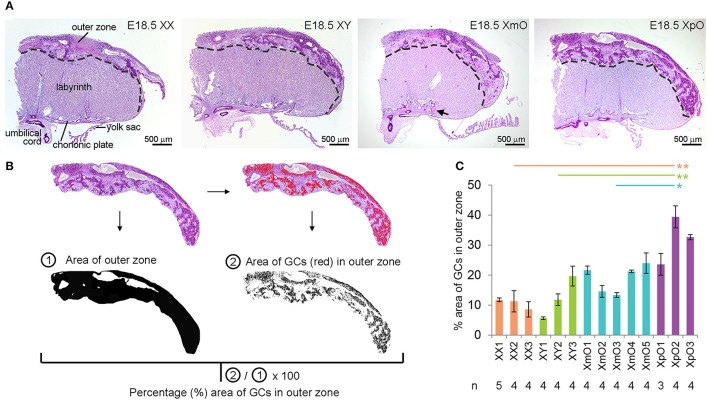
Figure 1.
XpO placentas have a larger area occupied by glycogen cells in the outer zone. (A) Representative PAS-stained medial placental sections of the different genotypes (XX, XY, XmO, XpO). (B) From the images acquired by microscopy, the outer zone of the placenta is digitally selected, then converted to black-and-white on Image J to provide the total area of the outer zone. From the selected outer zone of the placenta, the dark PAS-stained glycogen cells (GCs) are identified digitally (red cells) by selecting a threshold on Image J. The percentage of the GCs in the outer zone of each placenta section is obtained by using the ratio of the area of GCs ②/total area of the outer zone ①. (C) Graph depicting the percentage (%) area of outer zone occupied by GCs in the different genotypes (XX, XY, XmO, XpO). Significant P-values between XpO placentas and the other genotypes are indicated by *P < 0.05 and **P < 0.01.

