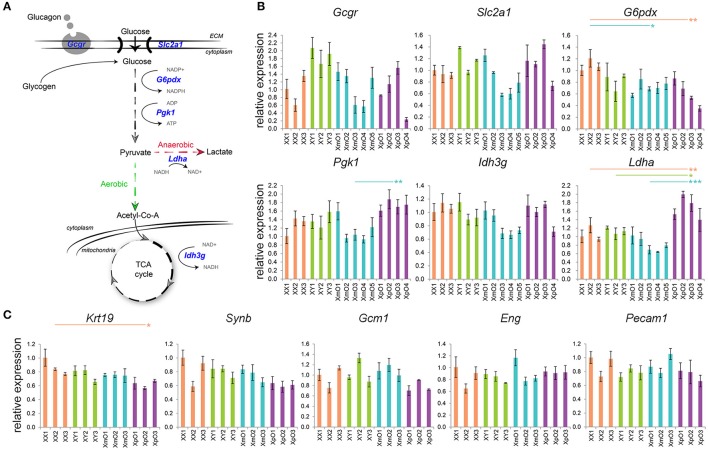
Figure 2.
Expression of genes related to glucose metabolism in the outer zone and expression of genes related to TE and vasculature in the labyrinth. (A) Scheme of glucose metabolism cascade, with the genes analyzed in blue. (B) Relative expression of the depicted genes in the outer zone of XX, XY, XmO, XpO placentas. Each bar represents mean ± standard deviation of technical triplicates of a different individual placenta. P-values were calculated between the different genotype-groups using one-way ANOVA with the Tukey-HSD. Significant P-values between genotypes are indicated by *P < 0.05, **P < 0.01, and ***P < 0.001. (C) Relative expression of the depicted genes in the labyrinth of XX, XY, XmO, XpO placentas. Each bar represents mean ± standard deviation of technical triplicates of a different individual placenta. Significant P-value between XX and XpO is indicated by *P < 0.05.

