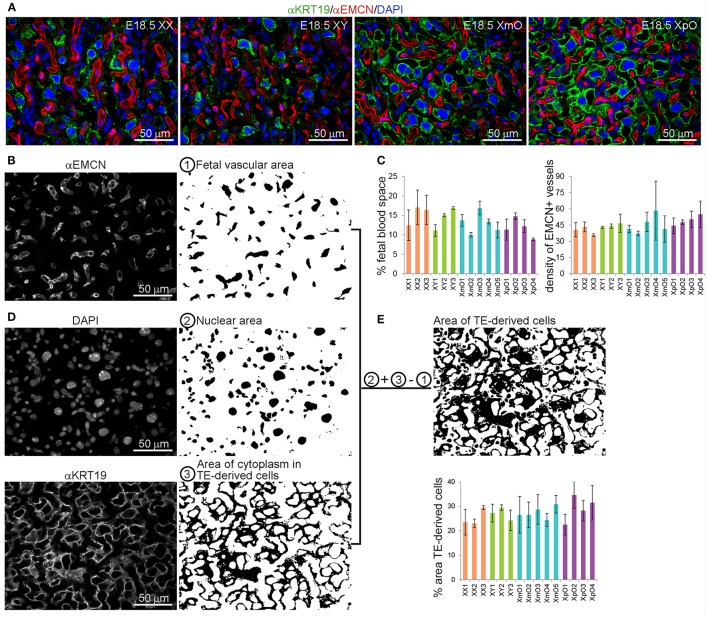
Figure 3.
XO placentas show comparable fetal vascular area and TE-derived cell area in the labyrinth. (A) Representative medial placental sections from the different genotypes (XX, XY, XmO, XpO) immunostained for KRT19 and EMCN show the organization of the fetal vasculature and maternal blood space in the labyrinth. (B) To quantify the fetal vascular area and density, single channel images for EMCN-positive fetal capillaries are filled with black area ① and either the number of vessels counted (density of fetal vessels in that area) or the percentage of fetal vascular area is quantified (sum of the area of EMCN-positive blood vessels/total area of the image × 100). (C) Graph depicting the percentage (%) of area occupied by fetal vasculature and the density of EMCN-positive fetal blood vessels in the different genotypes analyzed (XX, XY, XmO, XpO). (D) To calculate the percentage of area occupied by TE-derived cells, the single channel images for DAPI ② and KRT19 ③ are converted to black-and-white, added digitally and finally from that area (②+③) the fetal capillary area is subtracted (②+③−①) (sum of the resulting black area/total area of the image × 100). (E) Graph depicts the percentage (%) of area occupied by TE-derived cells in the different genotypes analyzed (XX, XY, XmO, XpO).

