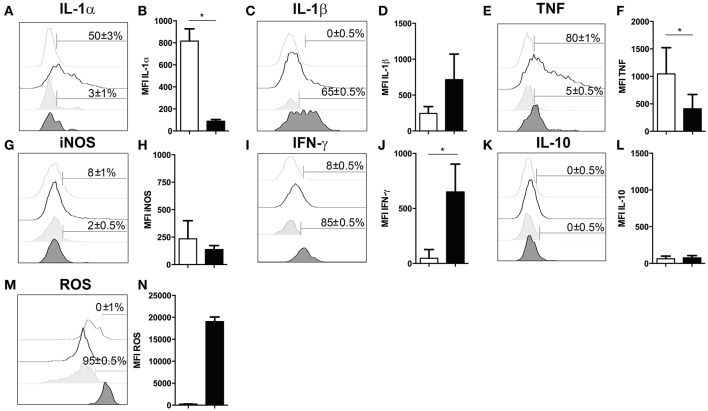
Figure 4.
Functional properties of neutrophil granulocytes and activated microglia in the infected brain. (A–N) Cells isolated from brains of mice infected with 4 weeks of T. gondii, were re-stimulated with Toxoplasma lysate antigen in vitro and analyzed by flow cytometry. The cells were gated as described in the Figure 1 (E–H). (A,C,E,G,I,K,M) Histograms show the representative expression levels of the indicated molecules in comparison to the corresponding isotype control (light gray without tint or light gray tinted). Bars mark cells positive for the particular cytokine. Numbers above bars represent the percentage of cells positive for the cytokine of the respective population: activated microglia (CD11b+CD45int) (without any tint), neutrophil granulocytes (CD11b+Ly6G+) (tinted). (B,D,F,H,J,L,N) Bar graphs represent the MFI of the respective fluorochrome for a particular cytokine, MFI ± SD (activated microglia: white bars; and neutrophils: black bars). Data are representative of 2 independent experiments with 5 mice per experiment. Mann-Whitney test was performed for comparisons (*p < 0.05). White bars and black bars represent activated microglia and neutrophil granulocytes respectively.

