Figure 8.
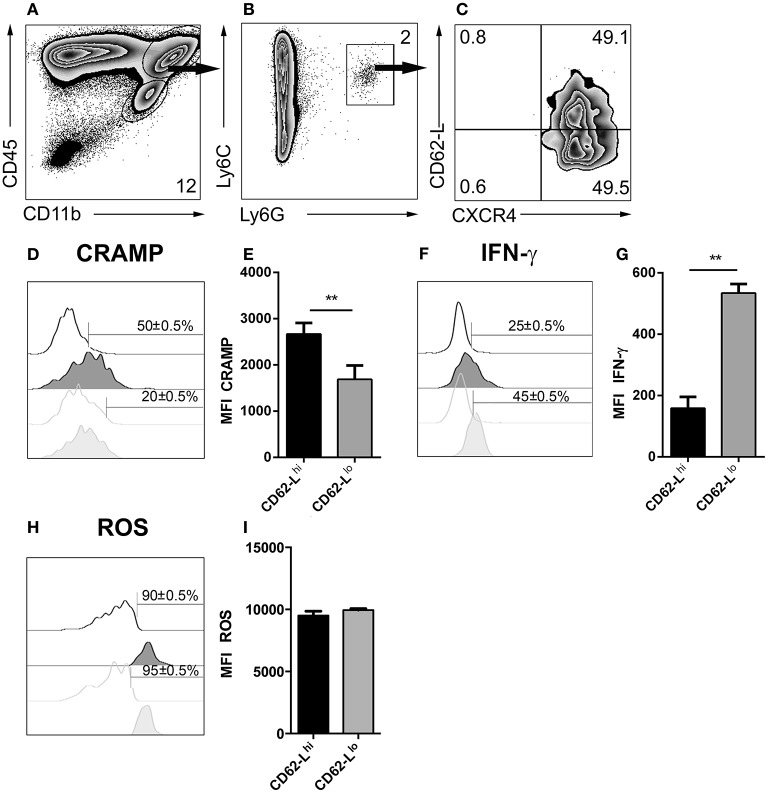
Emergence of neutrophil subsets in the CNS. (A,B) Cells isolated from 4 week T. gondii-infected mice were gated on CD45+CD11b+Ly6C+Ly6G+ neutrophils (C), and their CXCR4 and CD62-L expression was determined. The neutrophil granulocyte subsets CXCR4+CD62-Llo and CXCR4+CD62-Lhi were studied for their CRAMP, IFN-γ and ROS expression. (D,F,H) Representative histograms show CRAMP, IFN-γ, and ROS expression of CXCR4+CD62-Lhi (black filled) and CXCR4+CD62-Llo (gray filled) neutrophils as compared to the corresponding isotype control (black or gray, not filled). Bars mark the cells positive for the particular markers. Numbers above the bars represent percentage of cells positive for the marker of the respective population: CXCR4+CD62-Lhi (black) and CXCR4+CD62-Llo (gray). (E,G,I) Bar graphs represent the MFI of the respective fluorochrome for a particular marker, MFI ± SD (n = 4) (CXCR4+CD62-Lhi (black) and CXCR4+CD62-Llo (gray)). The numbers in the representative contour plots are % of the parent population. Data are representative of 2 independent experiments with n = 4 mice per experiment. Significant differences (**p < 0.01) in the bar graphs were determined using the Mann-Whitney test.

