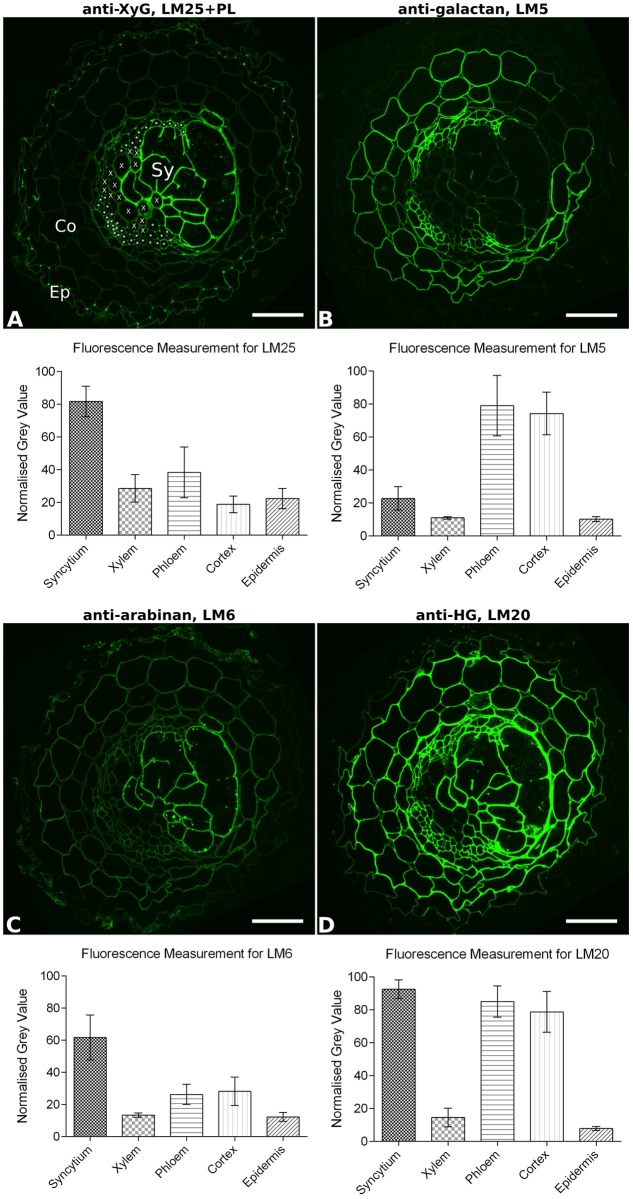
FIGURE 3.
Quantitative fluorescence analysis of general cell wall polymers in transverse sections of potato root infested with Globodera pallida (14 dpi). Fluorescence (green) images show the specific binding of mAbs (A) LM25 to xyloglucan (XyG), (B) LM5 to galactan, (C) LM6 to arabinan, and (D) LM20 to methyl-esterified homogalacturonan (HG), on equivalent serial sections. To aid interpretation, the cell types analyzed are indicated in (A): Ep, example epidermal cell; Co, example cortical cell; X, each xylem vessel, ∗ indicates each phloem element, Sy, syncytium. The extent of the syncytium can be most clearly visualized by the strong fluorescence in (A,C). Mean normalized fluorescence measurements for each cell type (n = 30–70) are shown. Error bars represent standard deviation. Differences in fluorescence between cell walls of syncytia and all other cell types are significant for each antibody (P ≤ 0.001; one-way ANOVA with Tukey’s multiple comparisons test). PL, section pre-treated with pectate lyase; Scale bar = 50 μm.

