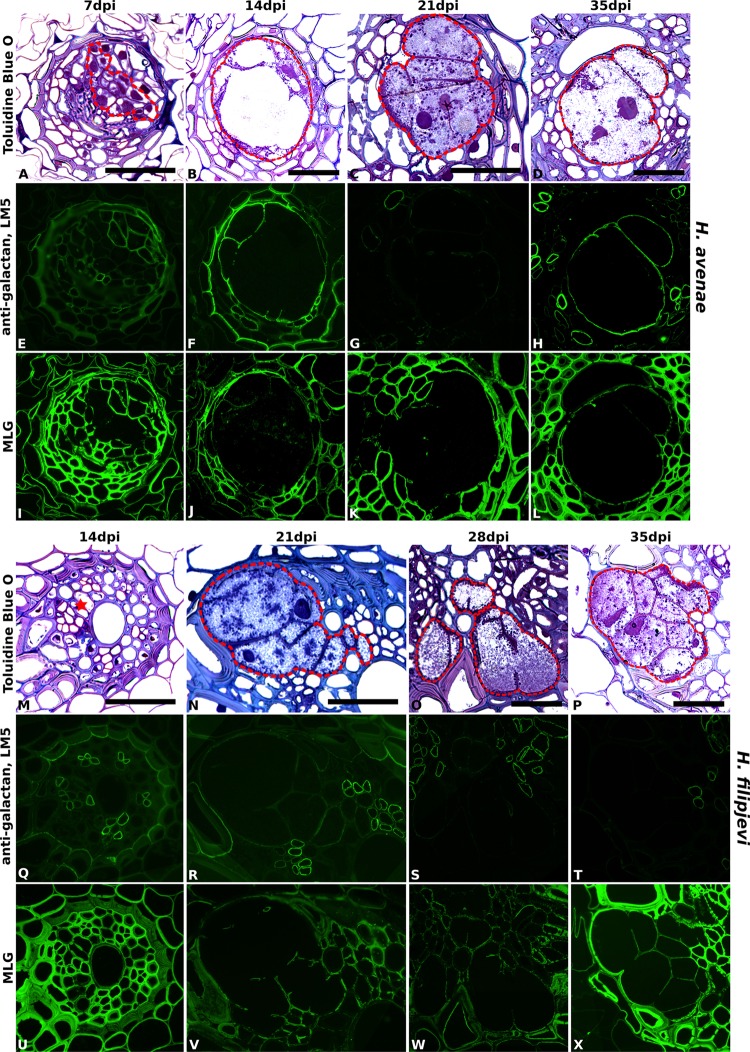
FIGURE 5.
Immuno-fluorescence imaging of galactan and MLG in syncytia induced by H. avenae and H. filipjevi within wheat roots (cv. Bobwhite). (A–D for H. avenae and M–P for H. filipjevi) Bright field images of Toluidine Blue O stained sections. Syncytial regions are outlined in red except for (M) where the likely developing syncytial region is denoted by a red asterisk. Indirect immunofluorescence (green) resulting from the binding of (E–H for H. avenae and Q–T for H. filipjevi) mAb LM5 to pectic galactan and (I–L for H. avenae and U–X for H. filipjevi) mAb MLG to mixed linkage glucan is shown for different time points after infection as indicated. Scale bar = 50 μm.

