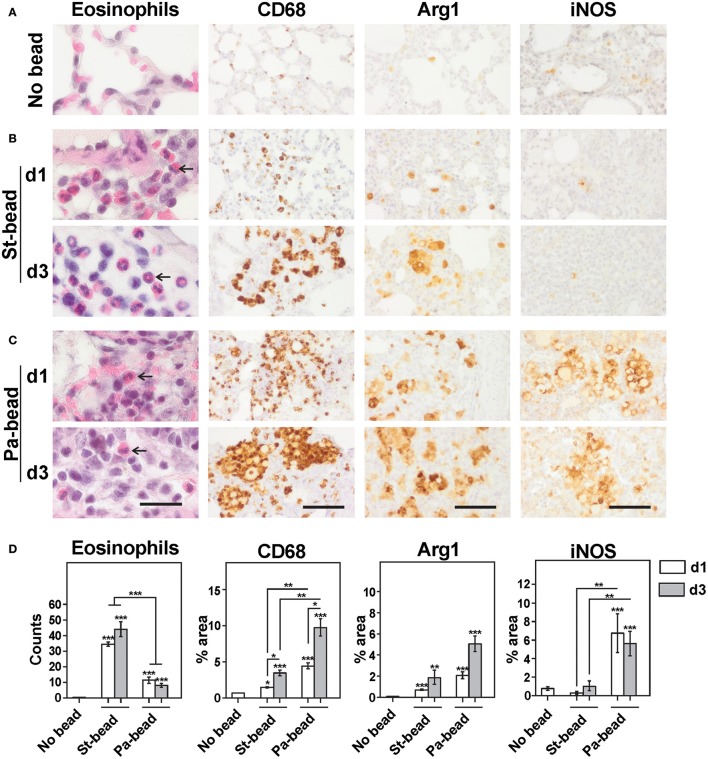
Figure 2.
Cellular infiltrates in sterile beads and CF rat model. Representative images for H&E and immunohistochemistry for CD68, Arg1 and iNOS for (A) No bead control group, (B) Sterile bead group (St-bead) and (C) P. aeruginosa bead group (Pa-bead). An increased influx of eosinophils was observed in St-bead group but also to a limited extent in the Pa-bead group (arrows). (D) Quantitative analyses for the histochemical and immunohistochemical stains. Data in (D) is presented as averages ± SEM; *P < 0.05, **P < 0.01, *** P < 0.001, and asterisk above the vertical bars denotes significance against No bead control group; n = 6 animals per group. (A–C), scale bar represents 20 μm for H&E stained and 60 μm for immunostained sections.

