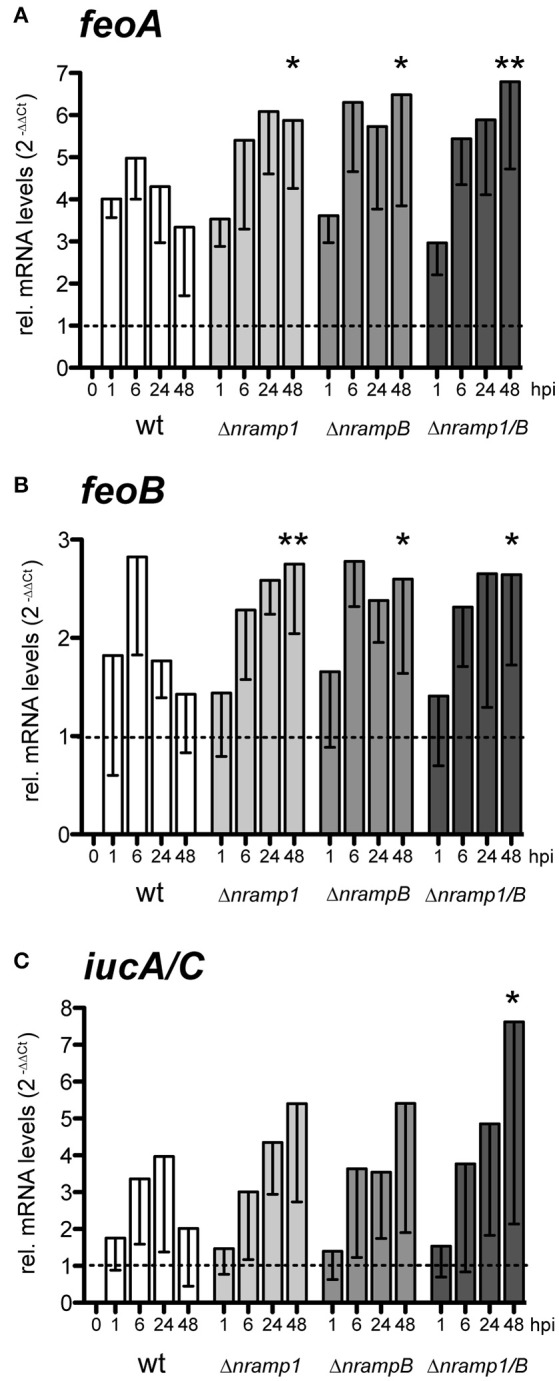
Figure 4.

Relative mRNA levels of F.n.n. iron associated genes during infection of Dictyostelium wt and nramp mutant cells. (A–C) Dictyostelium wt, Δnramp1, ΔnrampB, and Δnramp1/B cells were infected with F.n.n. wt GFP and mRNA amounts of F.n.n. feoA (A), feoB (B), and iucA/C (C) were measured by qRT-PCR over 48 hpi. In vitro cultivated F.n.n. supplemented with 2 mM FeCl3 served as a mock control (dotted line). For each timepoint, nramp mutants were compared to the wt using a repeated measures one-way ANOVA with Dunnett's post-hoc analysis: *p < 0.05, **p < 0.01.
