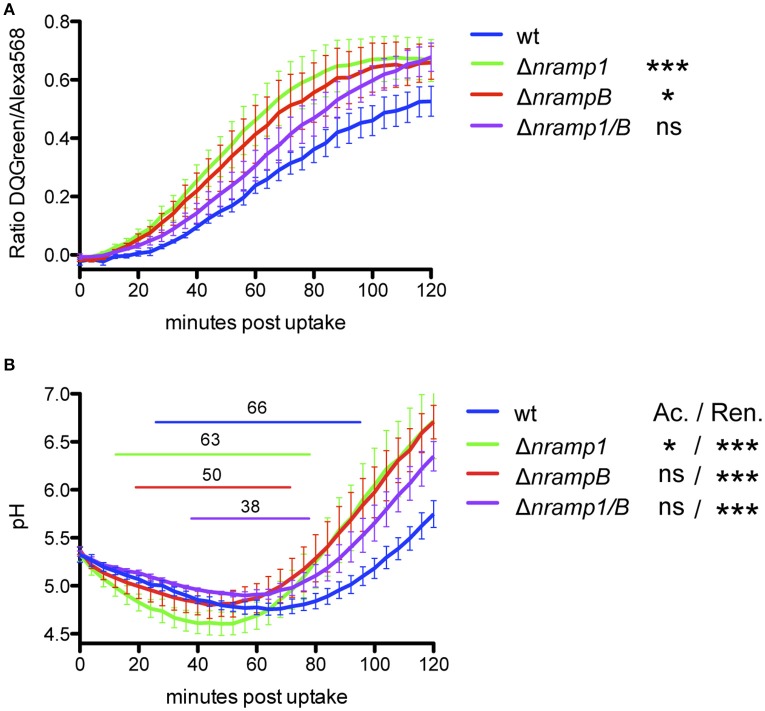
Figure 5.
Phagosomal proteolysis and acidification profile of Dictyostelium wt and nramp knockout cell lines. To monitore proteolysis (A) and pH (B) in the phagosome, Dictyostelium cells took up DQGreen-BSA/AlexaFluor568- or FITC/AlexaFluor568-labeled 3 μm silica beads by phagocytosis. The fluorescence emission ratio at 520/595 nm of intracellular beads was measured every 4 min for 2 h. (A,B) For statistical analysis of proteolysis and pH profiles of nramp mutants to wt cells, the slopes of the linear graph ranges were calculated and tested for significance using a one-way ANOVA with Dunnett's post-hoc test: *p < 0.05, **p < 0.01, ***p ≤ 0.001. Elevated lines in (B) indicate the starting point and duration of pH < 5 for each cell line. Displayed is the mean ± SEM of four independent experiments. Ac: Acidification, Ren: reneutralization.

