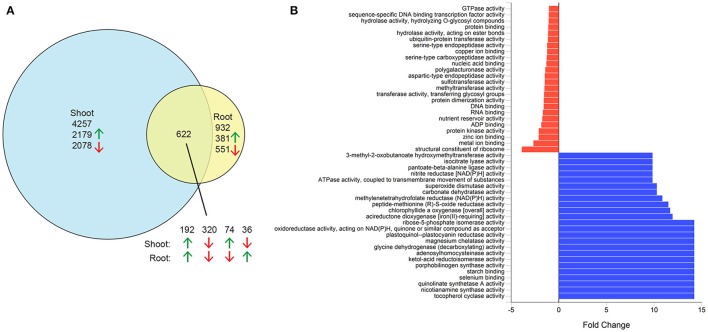
Figure 2.
Differentially expressed genes in salt-stressed quinoa. Three-week-old hydroponically grown plants were grown under control conditions or treated with 300 mM NaCl for 1 week. Root and shoot samples were used for RNAseq analysis. (A) Numbers of differentially expressed genes in shoots, roots or both tissues. Green arrows, upregulated genes; red arrows, downregulated genes. (B) Fold change of select molecular function gene ontology terms of genes upregulated in shoots in response to salt. Blue bars, enriched gene ontology terms; red bars, depleted gene ontology terms.

