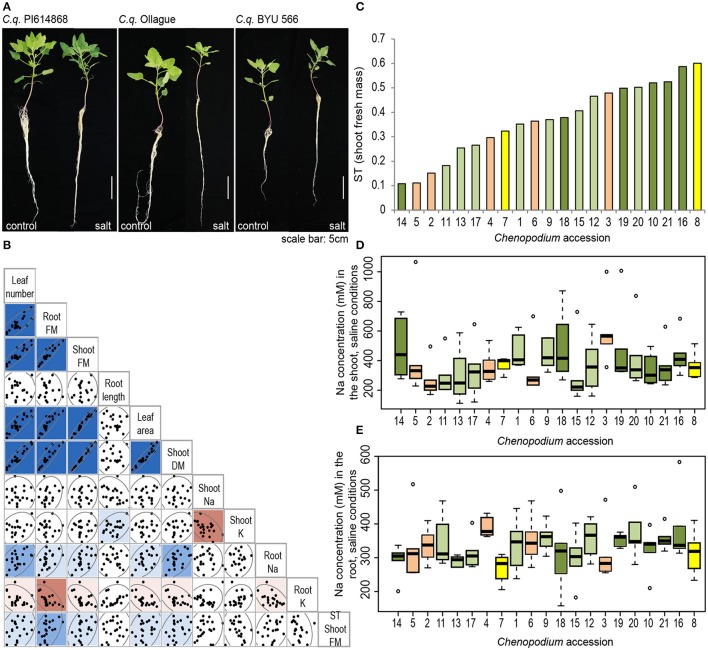
Figure 4.
Contrasting growth phenotypes among 21 Chenopodium accessions. (A) Comparison of the phenotype of three selected accessions grown hydroponically under control conditions (left) or under treatment with 300 mM NaCl for 7 days (right). Photos were taken on the day of harvest. (B) Correlation analysis among traits hypothesized to contribute to salinity tolerance. Traits displayed for plants grown under saline conditions. FM, fresh mass; DM, dry mass; K, potassium concentration; Na, sodium concentration; ST, salinity tolerance index of shoot fresh mass. Dark blue indicates a strong positive correlation (r > 0.7), medium blue indicates a moderate positive correlation (r > 0.5) and light blue indicates a weak positive correlation (r > 0.3). Medium red indicates a moderate negative correlation (r < −0.5) and light red indicates a weak negative correlation (r < −0.3). (C) Salinity tolerance index (ST) of each Chenopodium accession. Orange bars, C. berlandieri; yellow bars, C. hircinum; light green bars, quinoa highland; dark green bars, quinoa coastal. (D,E) Sodium concentration in the (D) shoot and (E) root of salt-treated Chenopodium accessions (n = 6); statistical analyses were performed as described in the Methods section, (F statistic for (D) <0.0001 and for (E) <0.0001). Accessions are described in Table 1. In short: (1) C. q. 0654; (2) C. b. Huauzontle; (3) C. b. BYU 937; (4) C. b. BYU 803; (5) C. b. BYU 14104; (6) C. b. BYU 1314; (7) C. h. BYU 1101; (8) C. h. BYU 566; (9) C. q. CICA-17; (10) C. q. G-205; (11) C. q. Ollague; (12) C. q. Pasankalla; (13) C. q. Real; (14) C. q. Regalona; (15) C. q. Salcedo INIA; (16) C. q. Cherry Vanilla; (17) C. q. Chucapaca; (18) C. q. Ku-2; (19) C. q. Ames 22157; (20) C. q. Kurmi; (21) C. q. PI 614868.

