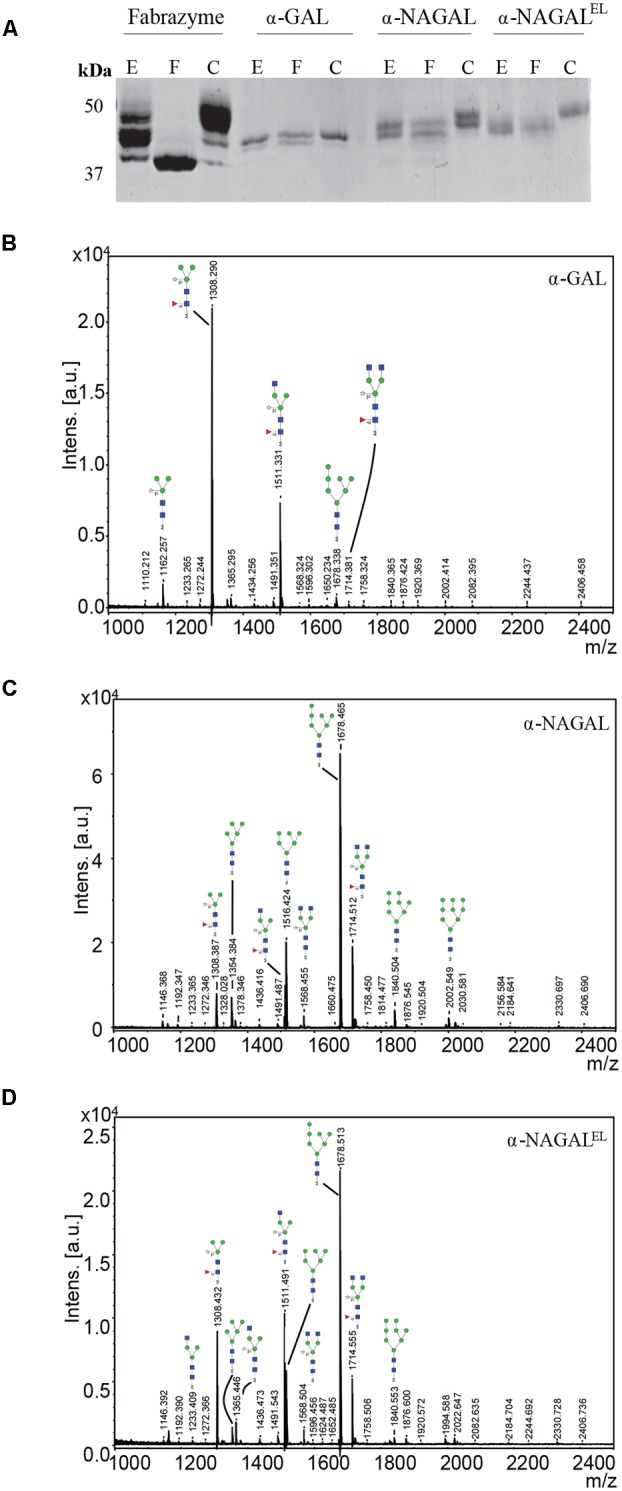
FIGURE 3.

N-glycans of α-galactosidases. (A) SDS-PAGE analysis followed by Coomassie Brilliant Blue staining of 1 μg pure plant produced proteins and 3 μg of Fabrazyme. E = protein treated with Endo H, F = protein treated with PNGase F, C = untreated protein. (B–D) N-glycosylation profiles were determined by MALDI-TOF MS analysis of 2-aminobenzoic acid derivatised PNGase-A released N-glycans of plant produced galactosidases. Glycan structures depicted were deduced from the measured m/z values. Blue square, N-acetylglucosamine; red triangle, fucose; open star, xylose; green circle, mannose. Presented N-glycan profiles of the following proteins: (B) α-GAL, (C) α-NAGAL, (D) α-NAGALEL.
