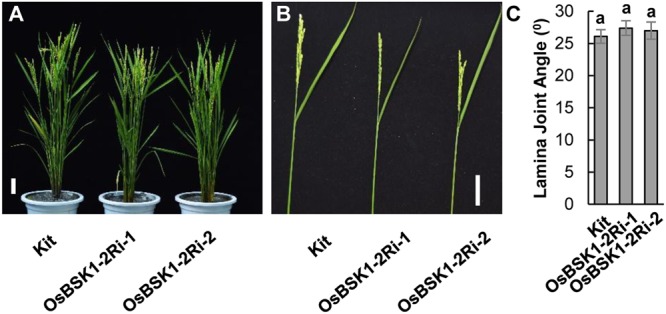
FIGURE 6.

Plant architecture of Kitaake plants with reduced expressions of OsBSK1-2. (A) The gross morphological phenotypes of Kitaake and transgenic plants silenced for OsBSK1-2. Bars = 10 cm. (B) Photograph of a representative leaf of Kitaake and OsBSK1-2Ri plants. Bars = 5 cm. (C) Statistical analyses on the lamina joint angles of Kitaake and the plants silenced for OsBSK1-2. The averages and SDs were calculated from 10 plants of the representative transgenic OsBSKRi lines as indicated (n = 10). The letters indicate significant differences using a one-way ANOVA followed by post hoc Tukey HSD analysis.
