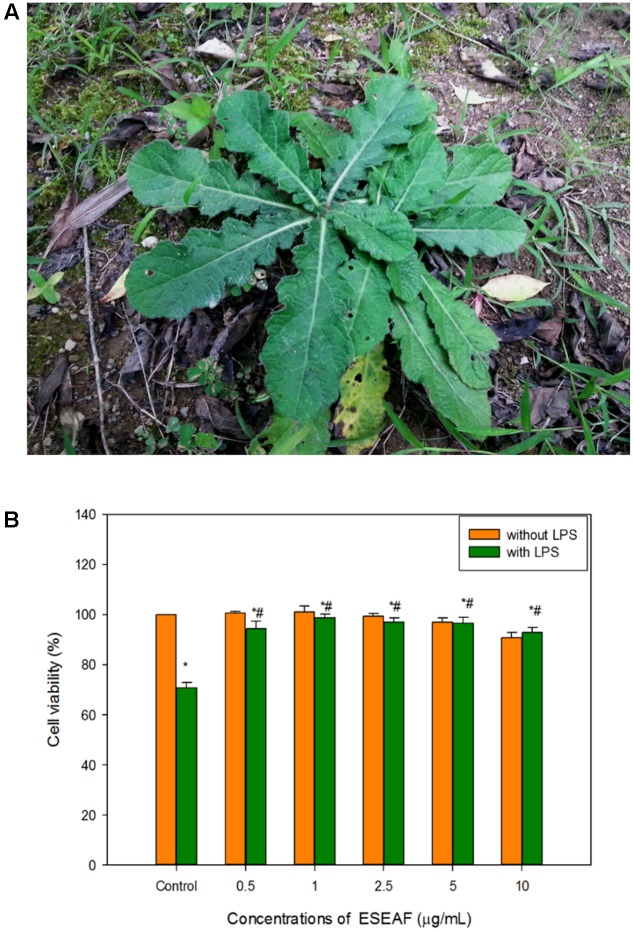
FIGURE 2.
Cell viability of ESEAF on lipopolysaccharide (LPS)-induced BV-2 cells. (A) The image showed the E. scaber. (B) The bar chart indicated the percentage of cell viability of ESEAF in LPS-induced BV-2 microglia cells. Values are expressed in mean ± SE (n = 3). Asterisks indicate significantly different from the control groups (∗p < 0.05). Hashtags indicate significantly different from the LPS-treated group (#p < 0.05).

