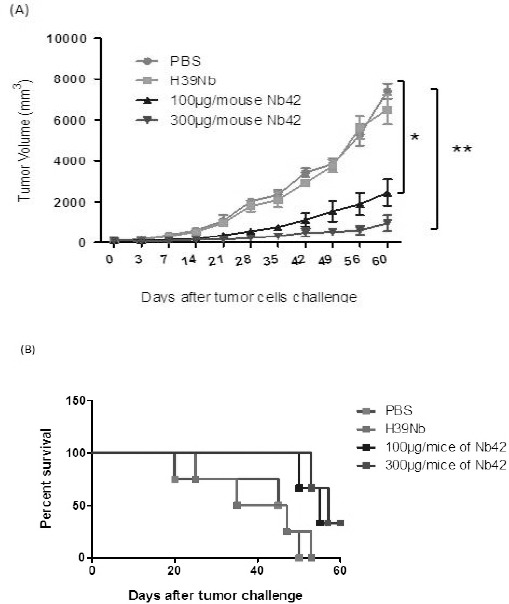
Figure 4.

In vivo treatment study results. Female C57BL/6 mice (6 mice per group) were injected with TC-1 cells (106 cells resuspended in 200 µl of PBS). (A) The mice were challenged 10 days after TC-1 inoculation. Tumor volume was monitored three times a week. Tumor increasingly grew in the control group (G1; PBS). While in treatment groups (G3; 100 µg/mouse of anti-VEGF NB and G4; 300 µg/mouse of anti-VEGF NB) tumor growth was significantly inhibited. The P-value for groups were as follows: G3 vs. G1 on days 42, 49, 56, and 60 (P=0.0237 *), G4 vs. G1 on days 42, 49, 56, and 60 (P=0.001 **). On the contrary, H39NB had no effect on tumor inhibition. Data are expressed as mean±SD. (B) Survival analysis. Survival curve after tumor challenge of each group was performed using Kaplan-Meier
