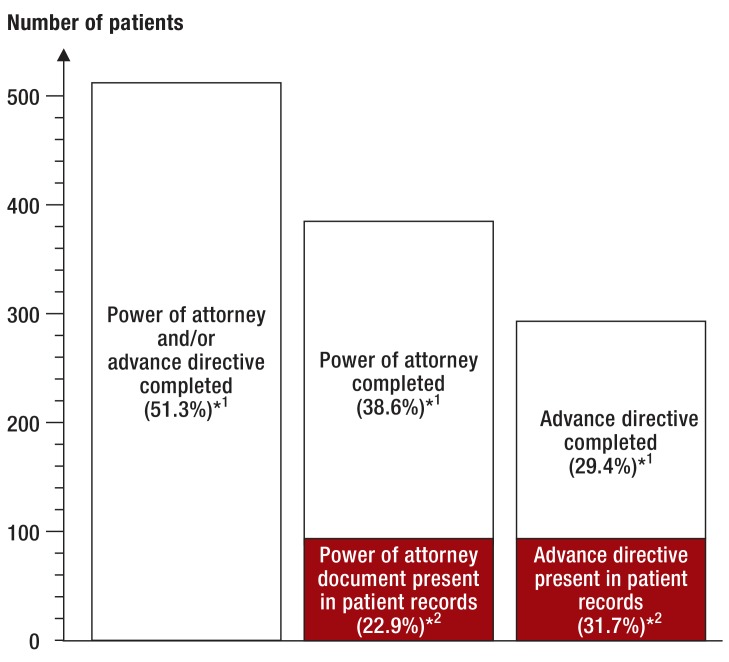
Figure.
Prevalence of powers of attorney and advance directives: percentages reported as completed in the whole study group and percentages actually present in patient records
*1 Percentage relates to the numbers reported by patients
*2 Percentage relates to the total number of powers of attorney or advance directives reported as completed by patients

