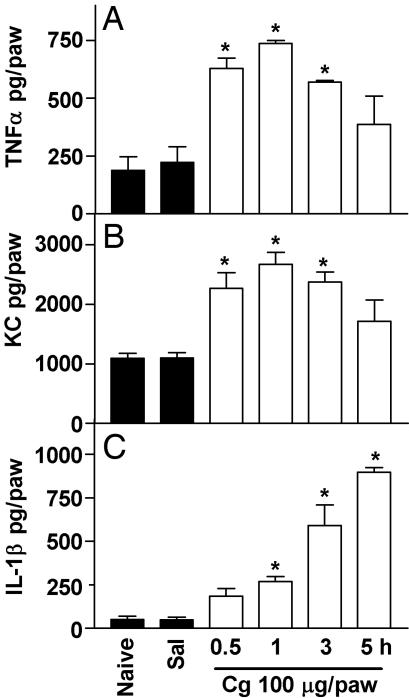
Fig. 5.
I.pl. injection of Cg-stimulated TNF-α, KC, and IL-1β production in paw skin. Concentrations of TNF-α (A), KC (B), and IL-1β (C) in mice paws injected with 100 μg of Cg or saline (Sal) or in naive paws. At 0.5, 1, 3, and 5 h after injection, mice were killed and paw skin samples were extracted for cytokines, which were measured by ELISA. The results are expressed by the mean ± SEM of four animals per group. *, Statistically significant differences compared with the control group (P < 0.05).

