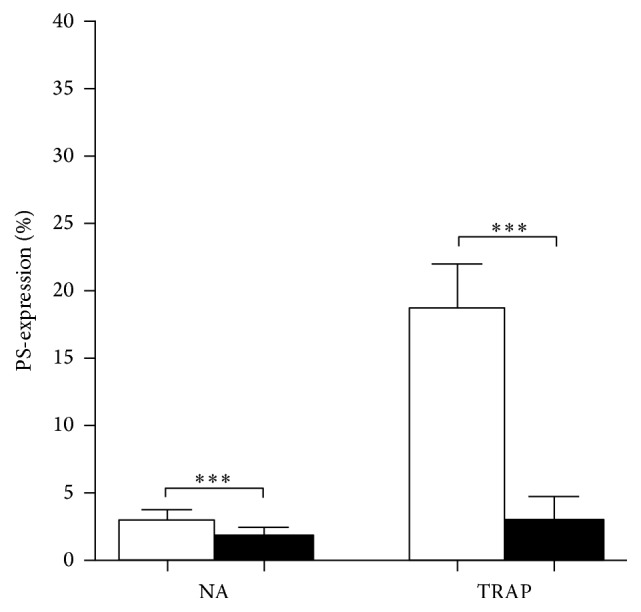
Figure 2.

Inhibitory effect of CLA on PS-expression. Nonactivated (NA) and activated samples are indicated with open bars and CLA-pretreated samples with black bars. The results are the mean and standard deviation (SD) of 8 different experiments. Statistical significance was assessed by paired t-test. ∗∗∗p < 0.001.
