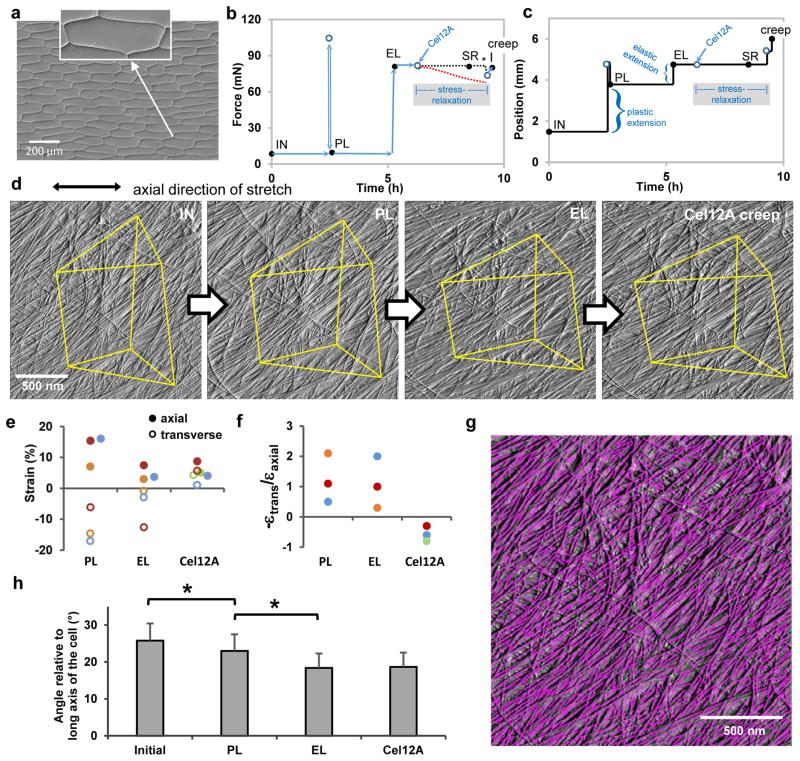
Figure 1. Microfibril reorientations during different modes of cell wall extension.
a, Light micrograph (differential interference contrast) of a peeled epidermal wall of onion scale, showing cell outlines. Peeling tears open the cells, leaving only the outer wall. We probed the cell side of the wall by AFM. Inset shows that the cell wall makes tight connections to neighboring cells. Residues of the anticlinal (side) walls are visible as short triangular flanges. b-c, Wall extension protocol showing coupled changes in force (b) and length (c) of wall specimen. AFM images were made at the five points indicated by the black circles: initial (IN, unstretched wall); after plastic (PL) extension; after elastic (EL) extension; after stress relaxation (SR) induced by treatment with Cel12A while cell wall length was held constant (period indicated by the shaded box); and after the cell wall was freed to extend (creep). During stress relaxation the force sensor registers the force applied to the locked movable stage (blacked dotted line), not the force borne by the wall sample which is approximated by the red dotted line (see Methods). At the end of the stress relaxation period, the movable stage is freed to move (*) and the sensor registers the actual force borne by the cell wall. The extensometer is then manually adjusted to restore the elastic holding force to its value before the addition of Cel12A. This accounts for the two closely-spaced points prior to the acquisition of the creep image. d, AFM Peakforce error images showing the same wall surface at four points in the extension series (the Cel12A-relaxed SR image is omitted because it is nearly identical to the elastic EL image; see Extended Data Movie 1). Yellow lines connect stable fiducial marks. e, Average axial and transverse strains measured from distances between 5–10 pairs of vertices (SEMs are 0.2 – 1.8 % strain). Colors are used to match experiment sets; axial strains denoted with solid circles, transverse strain with open circles. Points are offset laterally to improve visibility. f, Negative strain ratios for the three sets of experiments shown in (e). g, Automated detection of microfibrils with SOAX software; ‘snakes’ are colored magenta. h, Mean orientation of snakes (microfibril fragments) at four points in the extension protocol, for three experiments. Error bar = SEM, n = 3. Significant difference at P<0.05 indicated with *.

