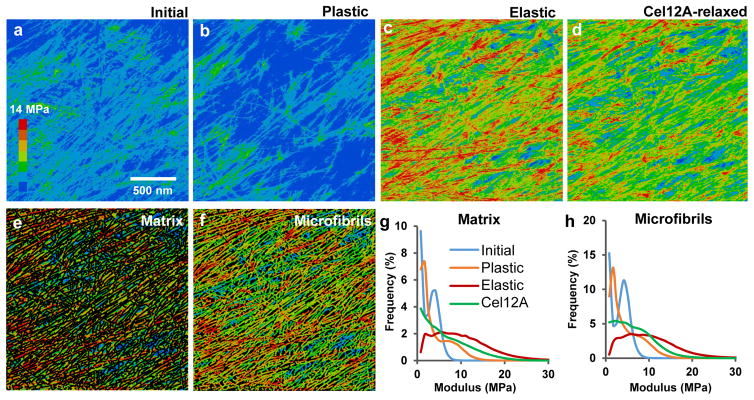
Figure 3. Modulus maps of cell wall surface after different modes of extension.
a–d, Heat maps of indentation modulus of the cell wall surface at four points in the extension series, collected in Peakforce tapping mode simultaneously with the images in Figure 1d. Color scale at left (step size = 2 MPa). Note that the modulus of axially aligned microfibrils is particularly reduced after Cel12A relaxation, indicating nonhomogeneous stress relaxation at the nanoscale. Modulus values increase when the holding force is restored (Extended Data Figure 5). e, Modulus map of the matrix component of the image in c, obtained by blacking out microfibrils identified with SOAX. f, Modulus map of the microfibril component of the image in c, identified by SOAX software. g, Histograms of the modulus distribution for the matrix for images a–d. h, Histograms of the modulus distribution for the microfibrils during four extension points shown in a–d. Note the y-axes in g and h differ by a factor of two and that values of 0–1 MPa are not graphed because of scaling issues; see Extended Data Figure 4 for an example of the complete distribution). This experiment was replicated three times with similar results. IN: Initial; PL: Plastic; EL: Elastic.

