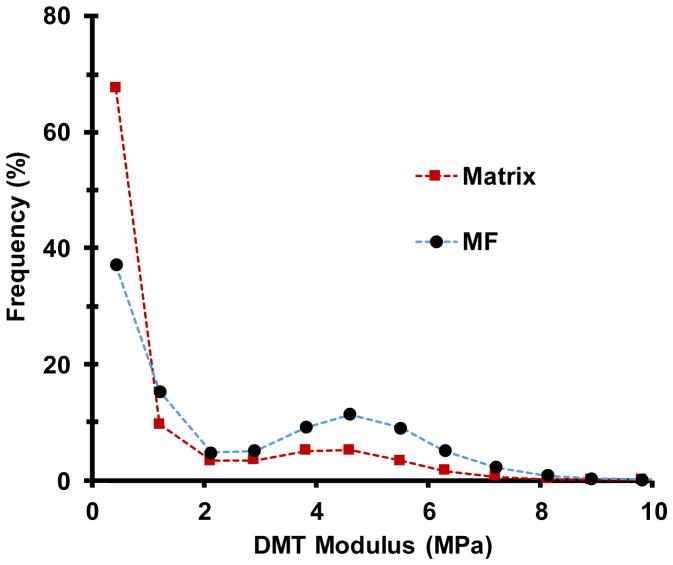
Extended Data Figure 4. Distribution of indentation modulus for pixels assigned to microfibril and matrix categories, for an unstretched (initial) onion cell wall.
The complete histogram shows the frequency of DMT modulus values (bin size = 0.78 MPa) for a single image measured by Bruker Nanoscope software. The dotted lines are provided for graphical use and not intended to imply a continuous variable. Points are plotted at the midpoint of each bin interval. This distribution is representative of three images.

