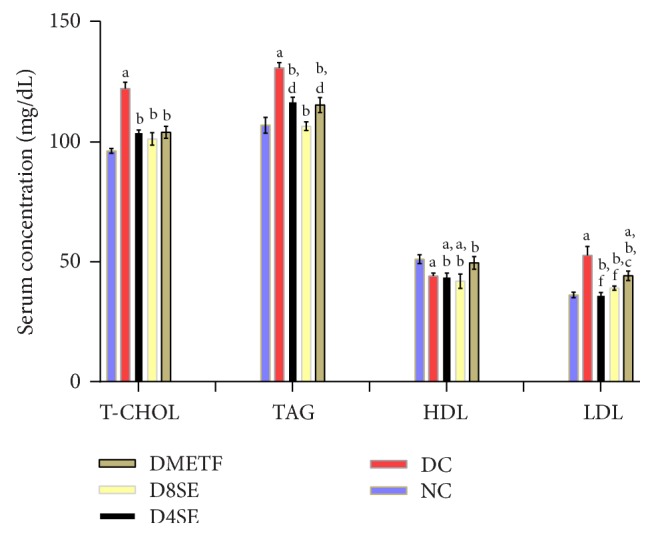
Figure 1.

Effects of SE on lipid metabolism in STZ-treated rats. Values are expressed as mean ± SEM of 8 rats. NC: normal control, DC: diabetic control, D4SE: diabetic animals treated with SE (400 mg∖kg BW), D8SE: diabetic animals treated with SE (800 mg∖kg BW), and DMETF: diabetic animals treated with metformin (12 mg∖kg BW). a: significant when compared to NC, b: significant when compared to DC, c: significant when compared to D4SE, d: significant when compared to D8SE, and f: significant when compared to DMETF.
