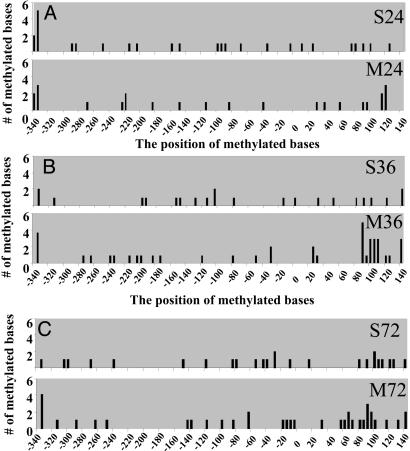
Fig. 3.
Methylation patterns of genomic DNA isolated from saline- and methionine-treated primary mouse cortical cultures. After the saline/methionine treatment, genomic DNA was isolated and treated with sodium bisulfite. PCR primers were used to amplify the reelin promoter region. The amplified material was subcloned, and individual clones were sequenced to determine the pattern and total number of methylated bases. A minimum of 11 clones from each treatment set were sequenced. The saline-treated controls were time-matched for each group and performed in parallel. (A) Twenty-four-hour treatment of saline (S24) and methionine (M24). The total number of methylated cytosines for S24 is 27, and for M24 is 24. (B) Thirty-six-hour treatment of saline (S36) and methionine (M36). Total number of methylated cytosines for S36 is 22, and for M36 is 41. (C) Seventy-two-hour treatment of saline (S72) and methionine (M72). The total number of methylated cytosines for S72 is 25, and for M72 is 37.

