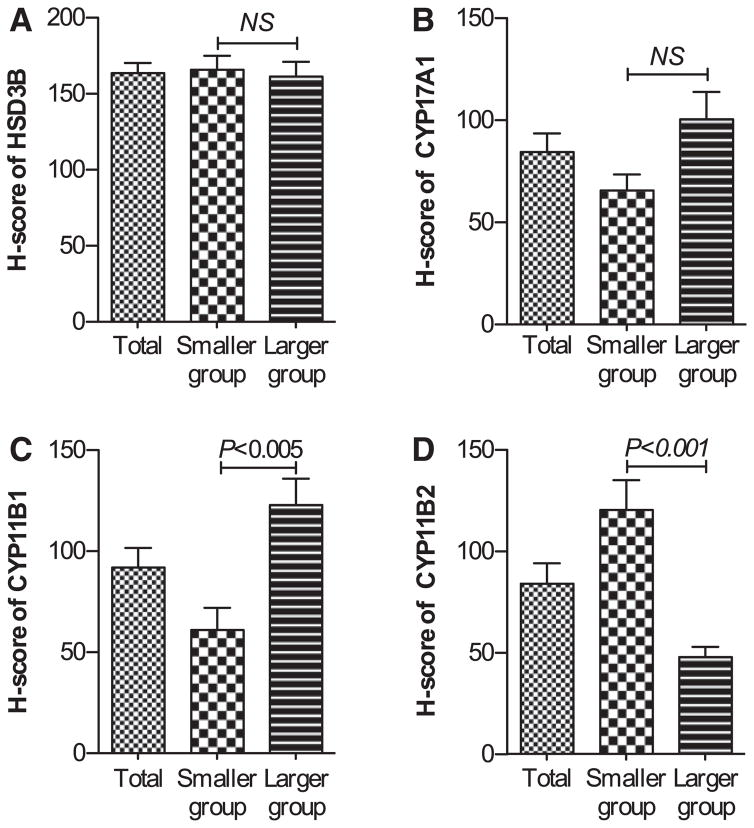
Figure 4.
H scores of HSD3B (A), CYP17A1 (B), CYP11B1 (C), and CYP11B2 (D) in the smaller and larger aldosterone-producing adenoma (APA) groups. There were no significant differences between groups with respect to the H scores of HSD3B or CYP17A1, whereas there were significant differences with respect to the H scores of CYP11B1 and CYP11B2. NS indicates not significantly different between the smaller and larger APA groups. Error bar: SEM.

