Figure 10.

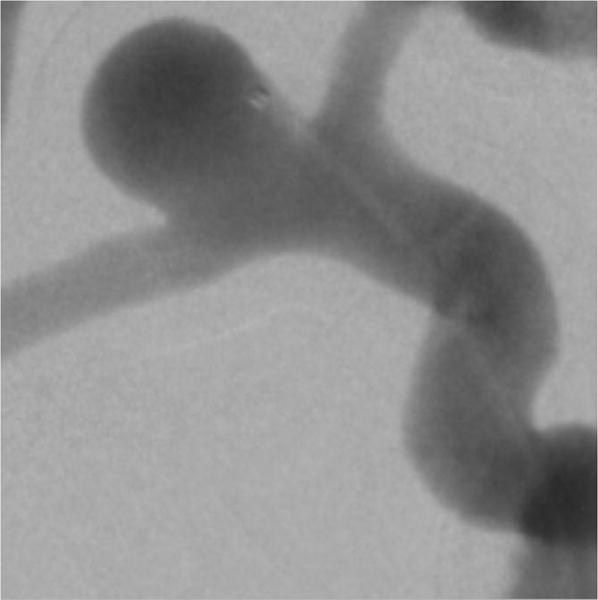
Digital subtraction angiography image, indicating a right side MCA and ACA bifurcation aneurysm. The image was acquired using the FPD. The dynamic study setup shown in figure 5 was used to simulate clinical x-ray attenuation conditions.

Digital subtraction angiography image, indicating a right side MCA and ACA bifurcation aneurysm. The image was acquired using the FPD. The dynamic study setup shown in figure 5 was used to simulate clinical x-ray attenuation conditions.