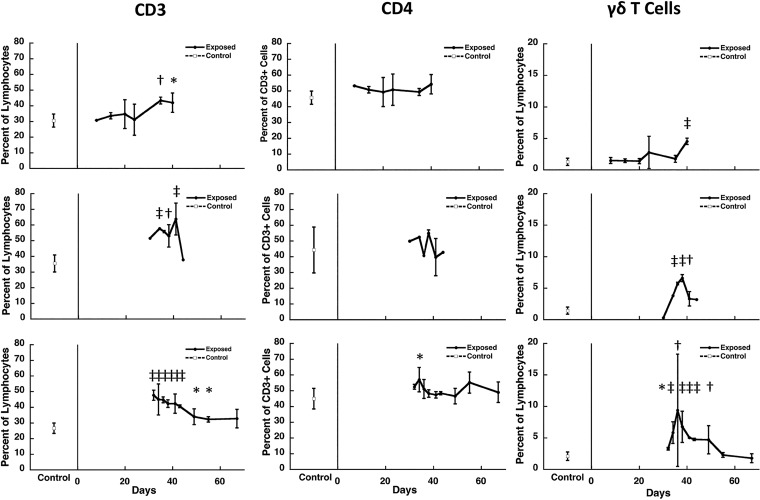
FIG 1.
Kinetics of cell subsets in the lungs of Pneumocystis-infected C57BL/6 mice. The percentage of CD3+ T cells and γδ T cells as a percentage of total lymphocytes and of CD4+ T cells as a percentage of CD3 cells isolated from the lungs of Pneumocystis-infected mice over time in three separate studies that cover the period from initial exposure to clearance of infection (days 8 to 76 following start of cohousing with a seeder) was determined. Each row represents the same experiment. The results represent the means and standard deviations for mice from all cages within a single experiment at a given time point. Controls, indicated at the left of each panel, are the mean for uninfected animals from the same experiment that were processed at the same time as the exposed animals. The cells were isolated from lungs at the indicated time points (x axis) after the start of cohousing with Pneumocystis-infected seeders and analyzed by flow cytometry. Due to the limitations in the number of animals that could be housed per cage, two to four exposed animals were studied at each time point per experiment, except as indicated by the absence of error bars, when only one animal was available for analysis. Six to ten controls were included in each experiment. Significant differences compared to uninfected controls are indicated by symbols: *, P < 0.05; †, P < 0.01; and ‡, P < 0.001.

