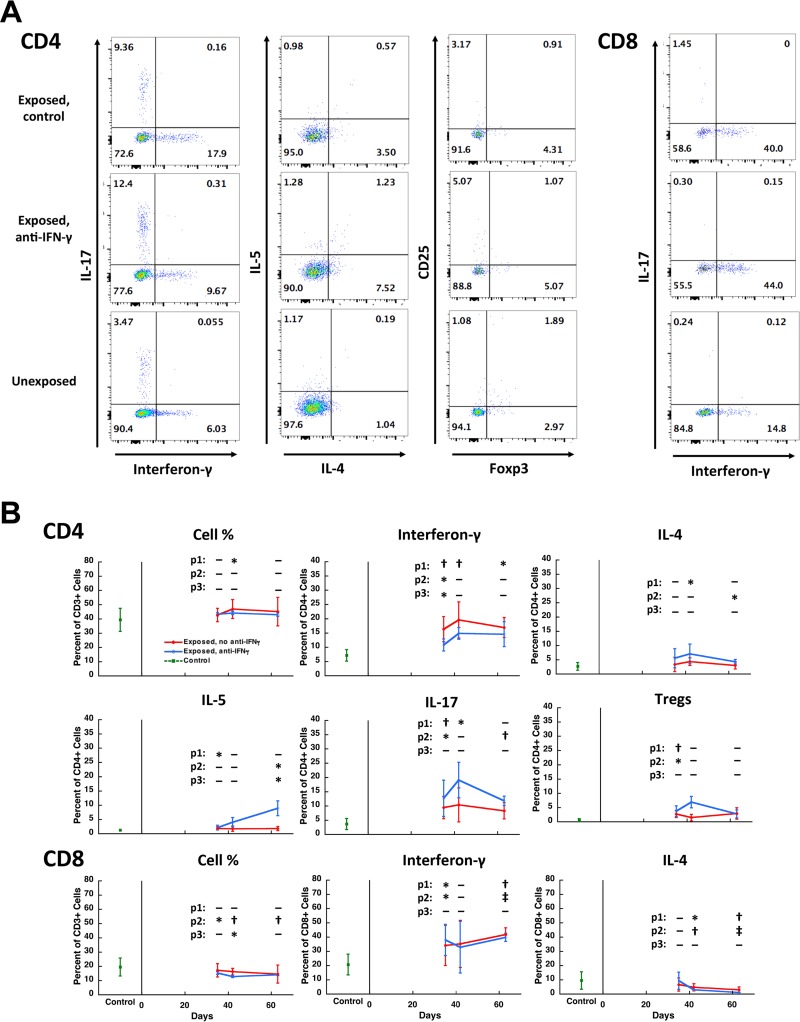
FIG 5.
CD4+ and CD8+ T cell subsets during Pneumocystis infection. (A) Representative dot plot panels of lymphocytes from the lungs of three Pneumocystis-infected and uninfected animals showing the percentage of CD4+ (left three columns of panels) and CD8+ (right column of panels) T cell subsets that are producing IFN-γ, IL-17, IL-4, or IL-5 or are Tregs (CD25+/Foxp3+). The top row is from an untreated Pneumocystis-infected animal (day 35), the middle row is from a Pneumocystis-infected animal (day 35) that received anti-IFN-γ antibody twice weekly starting at the beginning of exposure to a Pneumocystis-infected seeder mouse, and the bottom row is from an uninfected control. Numbers within the quadrants indicate the percentage of cells in each quadrant. (B) Mean percent expression of the indicated parameter over time, combining animals from three experiments. CD4 and CD8 cell numbers were gated on CD3+ cells; other parameters were gated on CD4+ or CD8+ T cells. The red line indicates untreated Pneumocystis-infected animals, the blue line indicates anti-IFN-γ antibody treated Pneumocystis-infected animals, and the green square indicates uninfected control animals. Error bars represent standard deviations. Days 35 and 36 were combined for this analysis. P values are indicated as follows: p1, uninfected versus untreated Pneumocystis-infected animals; p2, uninfected versus anti-IFN-γ antibody-treated Pneumocystis-infected animals; p3, untreated versus anti-IFN-γ antibody-treated Pneumocystis-infected animals from the same time point. Significant differences are indicated as follows: *, P < 0.05; †, P < 0.01; and ‡, P < 0.001. Pneumocystis organism load as determined by Q-PCR was not significantly different between the untreated and anti-IFN-γ antibody treated groups at any time point. The mean log10 (standard deviation) dhfr copies/mg of lung tissue for untreated and anti-IFN-γ antibody-treated animals, respectively, were as follows: days 35 to 36, 3.73 (0.32) and 4.04 (0.25); day 42, 2.79 (1.37) and 3.33 (1.35); and day 63, 2.82 (1.87) and 1.36 (0.39). By day 63, one animal in each group had cleared infection, and all animals in both groups had developed antibody responses as determined by ELISA. Two animals with markedly enlarged lungs were excluded from the analysis due to a concern that they were coinfected with another pathogen; inclusion of these animals did not change the results of the statistical analyses.

