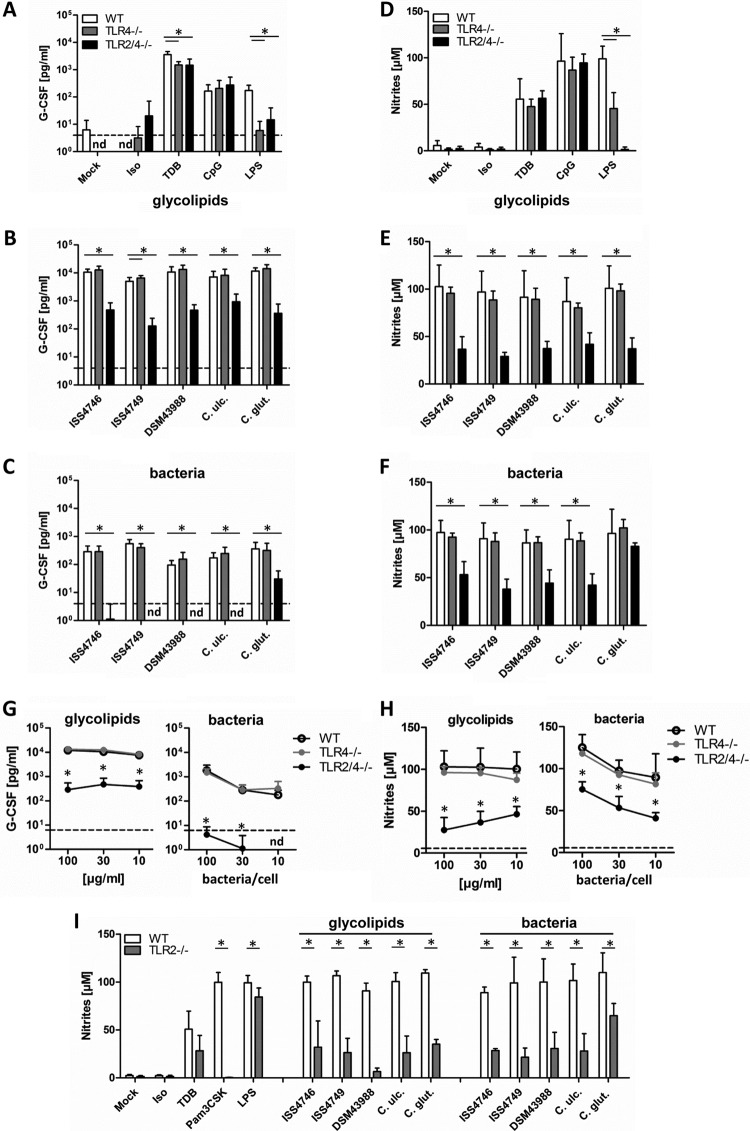
FIG 5.
TLR2 deficiency impairs G-CSF and NO production in macrophages stimulated with corynebacteria or their cell wall glycolipids. (A to C) BMM from TLR4-deficient or TLR2/4-double-deficient mice and their respective wild-type controls were stimulated with different glycolipid extracts (30 μg/ml) or the corresponding heat-killed bacteria (30 bacteria per cell) as well as controls for 48 h, as indicated. G-CSF cytokine levels in cell culture supernatants were determined by using an ELISA. The detection limit was 4 pg/ml (dotted line). nd, not detectable. (D to F) NO production in cell culture supernatants was determined by using a Griess assay. BMM were cotreated with 10 ng/ml IFN-γ. BMM were stimulated with different concentrations of glycolipids (100, 30, or 10 μg/ml) or heat-killed bacteria (100, 30, or 10 bacteria per cell). Data shown were obtained with glycolipids from C. diphtheriae ISS4746; extracts from the other corynebacterial strains/species showed similar dose-response curves (not shown for clarity). (G and H) G-CSF levels and NO production were analyzed as described above. Dotted lines represent G-CSF or nitrite levels from unstimulated BMM. Note that data points for WT and TLR4−/− BMM overlap in panel G. Data are depicted as means and standard deviations of results from 3 independent experiments performed in duplicates (n = 6). (I) Wild-type and TLR2-deficient BMM were stimulated as described above for panels A to C, followed by NO measurement. Data are depicted as means and standard deviations of results from 3 independent experiments performed in duplicates (n = 6). In panels B, C, and E to I, * indicates a P value of <0.05.

