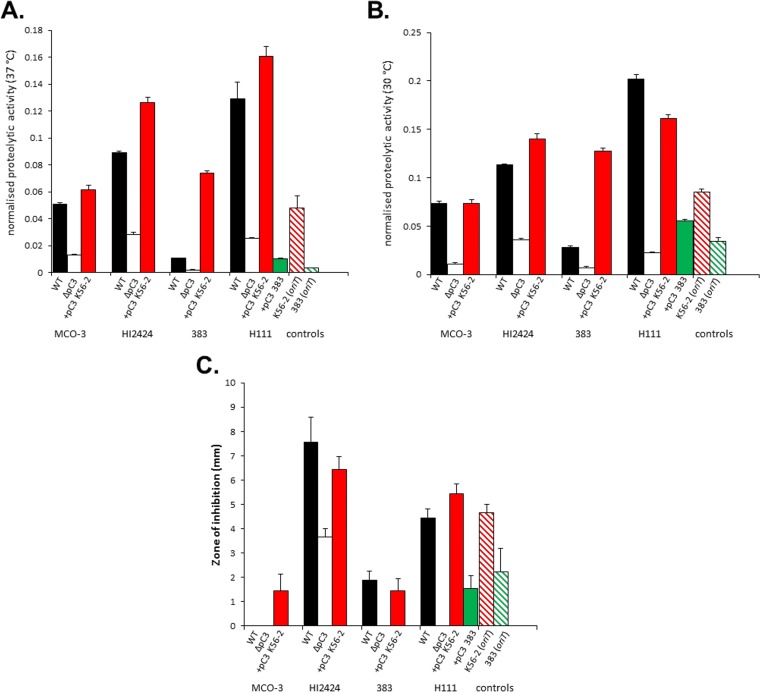
FIG 7.
Phenotypes exhibited by strains bearing nonnative pC3s. For each set of bars, the strain background is given at the bottom of the graph (strains were B. cenocepacia MCO-3, HI2424, and H111 and B. lata 383). Black bars represent the value obtained for the wt, white bars are for the pC3-null derivative, and red bars are for the transfer strain bearing pC3K56-2. For H111, a further transfer strain was constructed, bearing pC3383, shown in green. Control strains were B. cenocepacia K56-2 and B. lata 383 bearing a mobilizable plasmid integrated into pC3 to allow transfer by conjugation. Error bars represent standard deviation across biological triplicates. (A) Proteolytic activity in cells grown at 37°C. Bars represent the normalized proteolytic activity of each strain. (B) Proteolytic activity in cells grown at 30°C. Bars represent the normalized proteolytic activity of each strain. (C) Antifungal activity against F. solani. Bars represent the mean zone of inhibition surrounding the bacteria. Plates were incubated at room temperature for 9 days.

