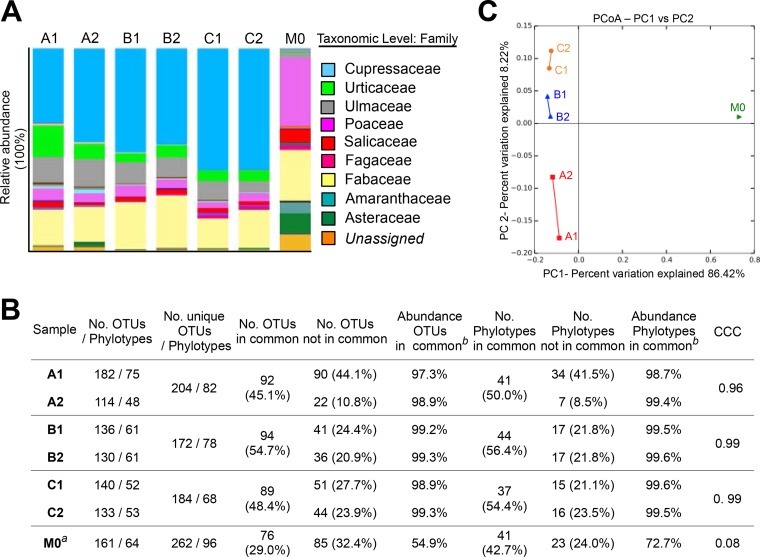
FIG 1.
Diversity of plants determined by NGS, statistics, and beta diversity analysis. (A) Relative abundances of the taxonomic assignments. Only the taxa representing ≥2% are identified in the legend. (B) Statistical analyses for OTUs and phylogenetic taxa. CCC, concordance correlation coefficient. The superscript “a” indicates a comparison with sample A1; the superscript “b” indicates relative abundances compiled by analysis of the OTUs/phylotypes in common. (C) Beta diversity analysis. Principal-coordinate analysis (PCoA) was performed to determine the diversity of plants from a Bray-Curtis distance matrix comprising the replicates and the divergence sample M0.

