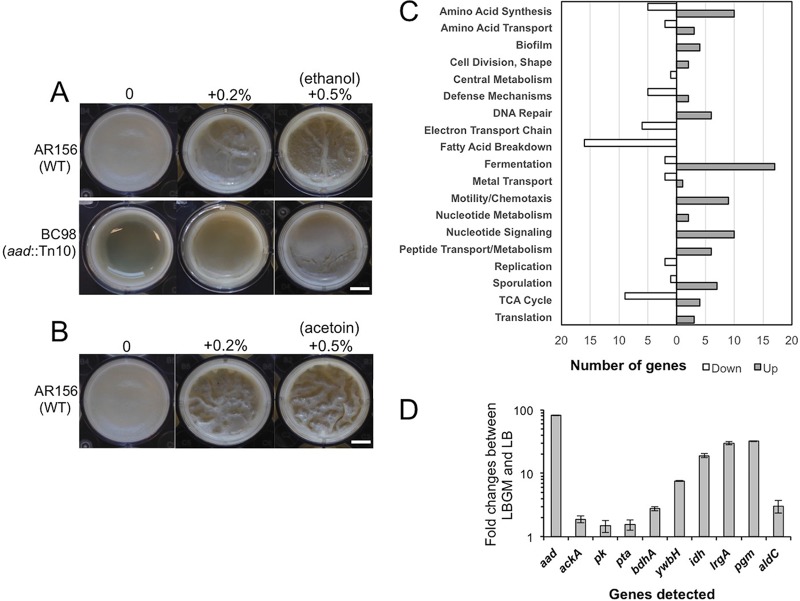
FIG 5.
(A and B) Ethanol- and acetoin-stimulated biofilm formation in B. cereus. (A) Pellicle biofilm formation by AR156 and BC98(aad::Tn) in LBGM in the presence or absence of ethanol. (B) Pellicle biofilm formation by AR156 in LBGM in the presence or absence of acetoin. Scale bars, 2.5 μm. WT, wild type. (C and D) Genome-wide transcriptome analyses of B. cereus AR156 cells during biofilm induction. (C) Summary of the genome-wide transcriptome analysis by RNA-seq. A total of about 500 genes whose expression was significantly altered under biofilm induction (in LBGM) compared to non-biofilm induction (in LB), are categorized into differential functional groups. The number of genes in each functional group was calculated based on the predicted function of the genes. Numbers on the x axis represent number of genes showing differential expression. (D) Validation of upregulation of 10 selected genes under biofilm induction (in LBGM) compared to non-biofilm induction (in LB) by reverse transcription-quantitative PCR (RT-qPCR). Down, downregulated; Up, upregulated.

