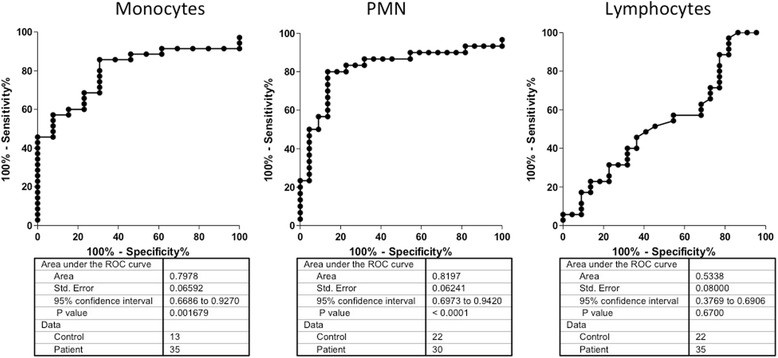
Fig. 6.

Evaluation of sensitivity and specificity of the test. A receiver operating characteristic curve (ROC curve) was built for normal individuals vs CML patients. Data obtained with TPγ B9-2 derived from patients shown in Fig. 5. A statistically significant capability to discriminate between CML and healthy subject is achieved when monocytes and PMN are evaluated. No/negligible expression of PTPRG in lymphocytes renders these cells unsuitable for the purpose
