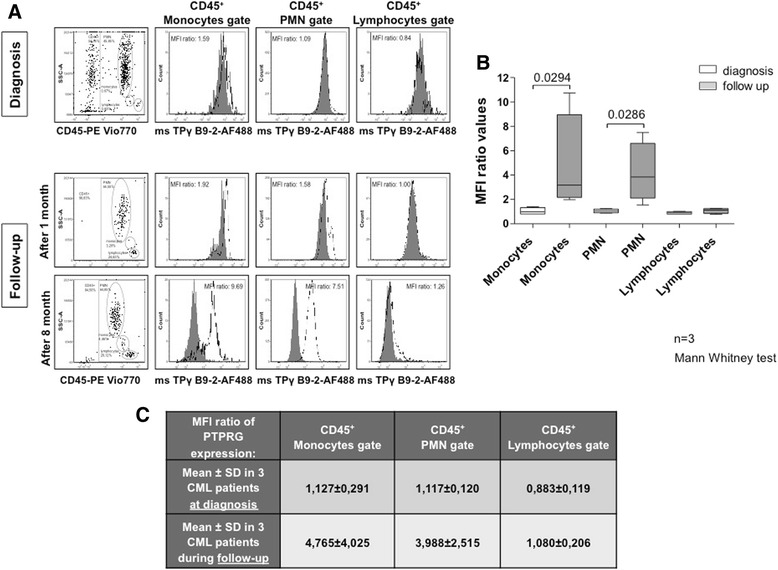
Fig. 8.

PTPRG expression in various leukocyte populations of CML patients at diagnosis and after treatment. a Representative flow cytometric analysis of PTPRG protein at diagnosis and at follow-up following successful TKI-based treatment. At diagnosis, monocytes and PMN downregulate PTPRG expression. After an average of 6 months of treatment, the levels of phosphatase expression recover and become similar to healthy donors. b Box-Whisker diagram displays significant differences between PTPRG expression in monocytes and PMN populations in three different CML patients at diagnosis and after treatment (statistical analyses are indicated on graphs). c The table summarizes the mean fluorescence intensity (MFI) values related to PTPRG expression shown in panel b
