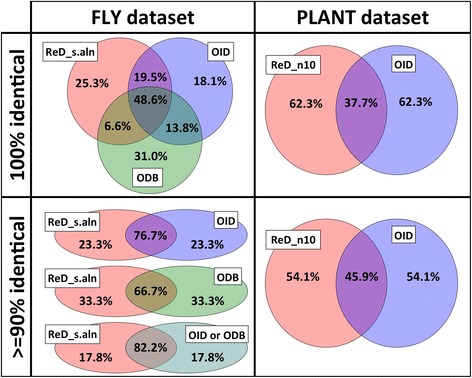
Fig. 2.

Output comparison between OrthoReD, OrthologID, and OrthoDB. The overall similarities of the outputs in two datasets (FLY and PLANT) generated under different conditions are compared based on the fraction of genes of interest with % identity above a threshold. ReD_s.aln and ReD_n10 (red) used OrthoReD, OID (blue) used OrthologID, and ODB (green) used OrthoDB to generate the output
