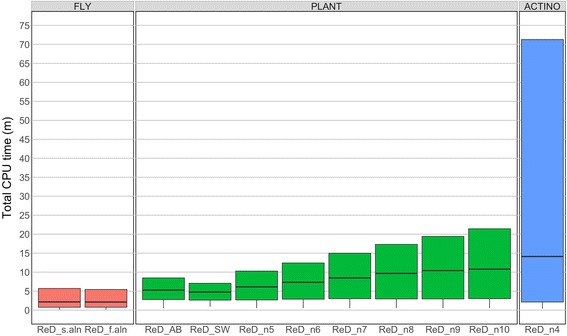
Fig. 3.

Total CPU time for each condition of OrthoReD. Each box indicates the total CPU time incurred by different conditions of OrthoReD. The line in the box indicates the median, upper and the lower ends of the box indicate the upper and the lower quartiles. The minimum runtime is indicated by the lowest point on the line extended below the box (lowest quartile). The maximum runtime is not indicated
