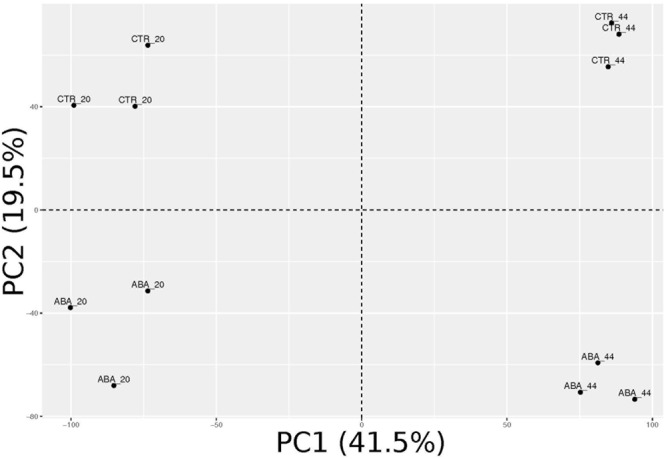
FIGURE 3.

Principal component analysis (PCA) of ABA-treated and control berry skin samples transcriptomes. Biological replicates are grouped and very well separated according to the experimental condition along the first two principal components, which together explain 61% of the overall variance.
