Abstract
In this pilot study we tested whether a low dose application of a mild diuretic substance such as eplerenone is beneficial in early stages of Duchenne muscular dystrophy using 23Na und 1H imaging, myometry, and clinical testing versus the glucocorticoid gold standard.
Two 7-years old patients with DMD were examined on a 3T MRI system. 1H MRI and 23Na density-adapted 3-dimensional radial MRI sequences were performed both before and 1, 3 and 6 months after therapy with eplerenone respectively cortisone. We quantified fatty infiltration on T1-weighted images using subcutaneous fat as reference and fat fraction with a two-point DIXON sequence. Muscle oedema was quantified on STIR images and DIXON water maps with background noise as reference. We quantified Na+ by a muscular tissue concentration sequence with a 51.3mM Na+ with 5% agarose reference tube. A Na+ IR-sequence was used for determination of mainly myoplasmic Na+. Correspondingly myometry of muscles and tendons were assessed. Clinical tests (i.e. 4-steps-test) and blood counts (i.e. K+) were done by a pediatrician.
Under eplerenone therapy we detected a reduction of muscular oedema, intracellular-weighted sodium IR signal and muscular sodium concentration. The oedema reduction in the DMD patient receiving eplerenone was more pronounced to the patient with cortisone. Myometric-measured tissue parameters such as muscle stiffness had a more pronounced effect in the child treated with eplerenone after a first increase in muscle stiffness both after eplerenone and cortisone treatment. Clinical abilities during both therapies were mostly constant.
Eplerenone might be a possible new therapy option in DMD patients.
Key words: Duchenne, eplerenone, 23Na MRI
Introduction
The progressive Duchenne muscular dystrophy is the most frequent and a severe muscular disease. Due to recessive x-linked inheritance boys are nearly solely affected. At birth symptoms are typically not present. At the time of school enrollment they present motor awkwardness. Subsequently, precarious walk, frequent falls, the phenomenon of GOWERS (this means that a patient has to use his hands and even arms to erect his own body from a squatting position) and the shamble walk indicate a muscular dysfunction. The loss of ability to walk usually appears at the age of 10. In the following wheelchair period muscular contractures of hip and knee muscles and scolioses evolve. A restrictive ventilation disorder as a result of muscular weakness and scoliosis is today treated by constant artificial ventilation and operative erection of the spine. Later on, cardiomyopathy will appear.
Present-day drug therapy, according to the current guidelines, consists of glucocorticoids which effect a light delay of muscular dystrophy. As glucocorticoids in the long-term cause grave adverse effects as osteoporosis, weight increase and even cortisone-induced (cardio-)myopathy, we attempt to test whether mineralocorticoids (without the previous named adverse effects) are more adequate in treatment of Duchenne muscular dystrophy. We have used eplerenone in this study, which is a specific antagonist of aldosterone and promote leachate of sodium and water out of muscle cells (1). That refers especially to the fact that the cytoplasm of DMD cells accumulate sodium and water even before the degeneration of the cell (1-3).
The missing dystrophin as a linker protein between cell membrane and contractile proteins causes major disturbance of the cellular mechanotransduction and overall gene expression of components of the extracellular matrix. Proteomic approaches demonstrate drastic increase of extracellular matrix proteins and cytoskeletal proteins leading to fibrosis (4). It has been demonstrated that eplerenone attenuates fibrosis of heart, vessels and liver (5).
Recently, Raman et al. (6) showed that low dose application of eplerenone is beneficial for early cardiomyopathy in Duchenne muscular dystrophy by preservation of ejection fraction and sustain left ventricular systolic function. A recent observation of a 22-years old Duchenne patient reported that eplerenone application had improved muscle strength and mobility (1).
Thus, we want to assess in a pilot study whether low dose application of eplerenone can be beneficial in early stages of Duchenne muscular dystrophy using recent imaging, clinical and tissue measurement techniques.
Patients and methods
Patients
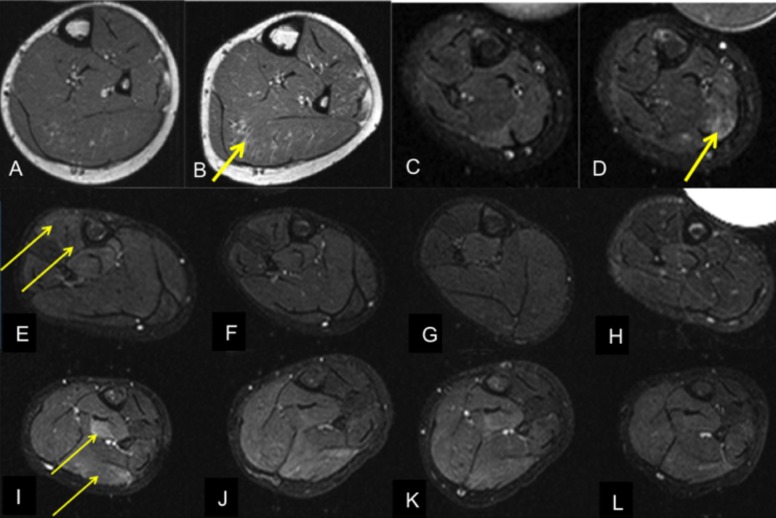
This individual drug treatment was conducted according to the Declaration of Helsinki in the present form. Written consent to treatment with eplerenone was obtained from all study subjects and their parents. Two boys with genetically proven DMD (one with eplerenone treatment (25 mg/day), one with glucocorticoid treatment (deflazacort, 0.9 mg/kg/day), all 7-years old were included. As control, two boys with DMD but without any treatment (same age, both 7-years old) who have already been examined with MRI twice before [data shown in (3) are mentioned in Figure 1; they underwent in addition to the data shown in (3) subsequent additional MRI examinations in a 3-year time (first patient) and 7-month time (second patient)].
Figure 1.
MRI of calves of four 7-years old boys with DMD. T1-w (A-B), short tau inversion recovery (STIR, C-L). Development of fatty muscular infiltration (T1-w) and muscular oedema (STIR). Two DMD patients (A-D) without therapy at any time in 3 years' (first patient without therapy, A-B) and 7 months' time period (second patient without therapy, C-D). DMD patient before (E) and 1,3 and 6 months (F-H) after therapy with glucocorticoids (0,9mg Deflazacort/kg/day). DMD patient before (I) and 1,3 and 6 months (J-L) after therapy with eplerenone (25mg/day). Increasing fatty degeneration of the soleus muscle (A-B) and increasing oedema-like changes in the medial gastrocnemius muscle (C-D) in two patients without therapy. Prior to therapy, oedema-like changes especially in the anterior compartment (E; afterwards glucocorticoid treatment) respectively deep posterior compartment and medial gastrocnemius muscle (I, afterwards treatment with eplerenone). Following therapy with glucocorticoids (standard) and eplerenone, there are decreasing oedema-like changes.
Patient examination protocol
The two boys of the first study arm (i.e. following glucocorticoid or eplerenone treatment underwent 3 Tesla 1H and 23Na imaging of both lower legs, myometry and clinical examination at 4 different time points (before therapy as well as 1, 3 and 6 months after respective therapy).
MRI protocol
1H and 23Na MRI of both calves were performed on a 3 Tesla clinical MR system (MAGNETOM Trio, Siemens, Erlangen, Germany) using a CE certified doubleresonant
birdcage coil (32.6 MHz/123.2 MHz, Rapid Biomed Inc., Würzburg, Germany). All patients tolerated the entire MRI examination well. The imaging protocol included axial T1-weighted turbo spin echo (for the dectection of fatty muscular degeneration) followed by axial short-tau inversion recovery (STIR) 1H MR sequences (for the identifaction of muscular oedema). Additionally, muscular fat fraction was measured using a two-point DIXON sequence. Sodium (23Na) imaging was performed using two 23Na pulse sequences based on a density-adapted three dimensional (3D) radial sequence (7). The first sequence (spin-density image contrast TE/TR = 0.3/100 ms, α = 90°; voxel size of 5 x 5 x 5 mm3; acquisition time (TA) = 8min 20s) assessed a spin density image contrast and was used to quantify the muscular tissue Na+ concentration; the second one (TE/ TR = 0.3/124ms; TI = 34ms, voxel size 6 x 6 x 6 mm3; TA = 10min 20s) – an inversion recovery sequence - suppressed the Na+ signal of free Na+ ions (e.g. Na+ in saline solution) and, therefore, shifting the weighing towards the intracellular compartment (8). At follow-up, the calves were positioned at exactly the same position using the knee joint space and the coil borders as reference and by using additional skin markers. The calves were well fixed in this position (in the coil) using foam plastic. Also, all examinations were performed by the same technician.
Analysis of the 23Na and 1H MR imaging data
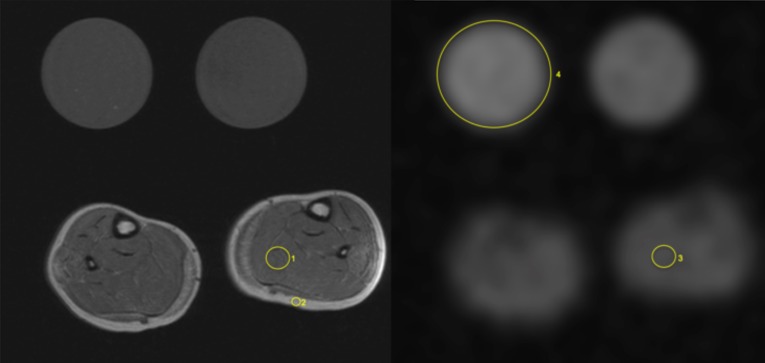
A radiologist with 3 years of experience in musculoskeletal imaging set in consensus with a senior musculoskeletal radiologist the positioning of the regions of interest (ROIs) on 4 different muscle compartments (anterior muscle compartment, peronaeus compartment, soleus compartment, deep posterior compartment) in the 23Na images on the lower legs of the examined patients (Fig. 2). The radiologists were blinded to the final treatment of the patients. The 1H imaging data served as reference. Additionally, two reference tubes were assessed with ROIs as described before (8). The first control phantom was filled with 51.3 mM NaCl solution to counterfeit unrestricted Na+, the other phantom used 51.3 mM NaCl in 5% agarose to mimic Na+ with restricted mobility. 23Na signals were normalized by dividing Na+ values of different muscles with signal intensity in the existing Na+ agarose control phantoms. Due to the fact that the reference tube with free NaCl solution was suppressed in the IR sequence, the tube containg NaCl in 5% agarose gel was used for normalization.
Figure 2.
Analysis of 1H MR and 23Na image data, DMD patient, exemplary measurements. 1H-T1w (left) and 23Na- MR image (spin density image contrast, no inversion recovery); reference tubes (in each image): right-hand side of the patient (51.3 mM NaCl in 5% agarose, mentioned as 4) and left-hand side (51.3mM NaCl solution) reference tube. Exemplary measurement of fatty infiltration using a 1H T1w Ratio (ROImuscle/ROIsubcutaneus fat) of the left soleus muscle (ROI 1/ROI 2 in left image); accordingly measurement of muscular sodium concentration using a 23Na-MR sequence (no IR, ROI of Na+ value of respective muscle / ROI of signal intensity in the existing Na+ agarose control phantom) within the left soleus muscle (ROI 3/ROI 4 in right image).
Fatty infiltration was measured using a 1H T1w Ratio (ROImuscle/ROIsubcutaneus fat) of the soleus muscle (Fig.2), fat fraction was measured using 1H DIXON of the soleus muscle (ROIs were set on water (w) and fat (f) images and followed by the calculation of the fat fraction ff = f/(f+w)). Additionally, 1H STIR imaging and 1H DIXON water maps were used for evaluation of oedematous changes. Therefore the extent of muscular oedema could be normalized each by using the backround signal (ROImuscle /ROIbackround noise).
Myometry/ Assessment of muscle viscoelastic properties
In addition to imaging data, biomechanical and viscoelastic parameters of muscles and tendons were assessed by a recently introduced handheld indentometer called MyotonPRO® (Myoton Ltd, London). This device measures the damping of a mechanical impulse of 0.5 N at the surface of the skin in the first 400 ms after impulse. From these oscillation curves, the following tissue parameters were calculated: the tissue tone (frequency (Hz)), the tissue stiffness (N/m), decrement as parameter for the elastic stiffness of the tissue and viscoelastic parameters like relaxation time (in ms) and creep as nonelastic tissue strain. Children were measured in a relaxed laying position. Three measurement sets of 10 measurements were performed on the left and right side for each position. Three measurements (mean of 10 taps each) were taken consecutively on the same position. For the skeletal muscles, the lateral M. gastrocnemius and upper M. trapezius (pars transversa) muscle belly were chosen as measurement position. The thoracolumbar fascia was measured at the level of the iliac crest, 3 cm lateral to the posterior median line at both sides. The Achilles tendon was assessed 4 cm proximal to the insertion of the Achilles tendon into the calcaneus. All aforementioned points were measured in prone position at both sides, except the M. trapezius that was measured in upright sitting position. A total of 30 measurements per position were recorded over 4 testing sessions before therapy and after 1, 3, and 6 months of drug administration, respectively, one year before the eplerenone administration. For the boy receiving eplerenone, the measurements were not performed directly before eplerenone intake.
Clinical examination
The examination comprised the measurement of blood pressure, body weight and several blood parameters (Na+, K+, Ca2+, TSH, CK, creatinine, carbamide, phosphate, cholesterine, triglycerids, LDL- and HDL-cholesterine, lipoprotein A and vitamin D). Muscle endurance and functional abilities were assessed by an pediatrician with a 10 meter walking and a 4-steps-test followed by tests for the functional evaluation of going up (from sitting on chair, lying and sitting on floor). The examiner was blinded to the treatment scheme of the patients.
Results
Patients without therapy
Two seven-year-old boys with genetically proven DMD underwent no therapy in our observation period.
The first boy showed increasing fatty degeneration of the left soleus muscle on 1H T1w images in a time-period of 3 years, while the second boy presented with increased muscular oedema in the the right medial gastrocnemius muscle during the 7 months' period.
Effect of therapy with eplerenone 23Na sodium and 1H MR imaging
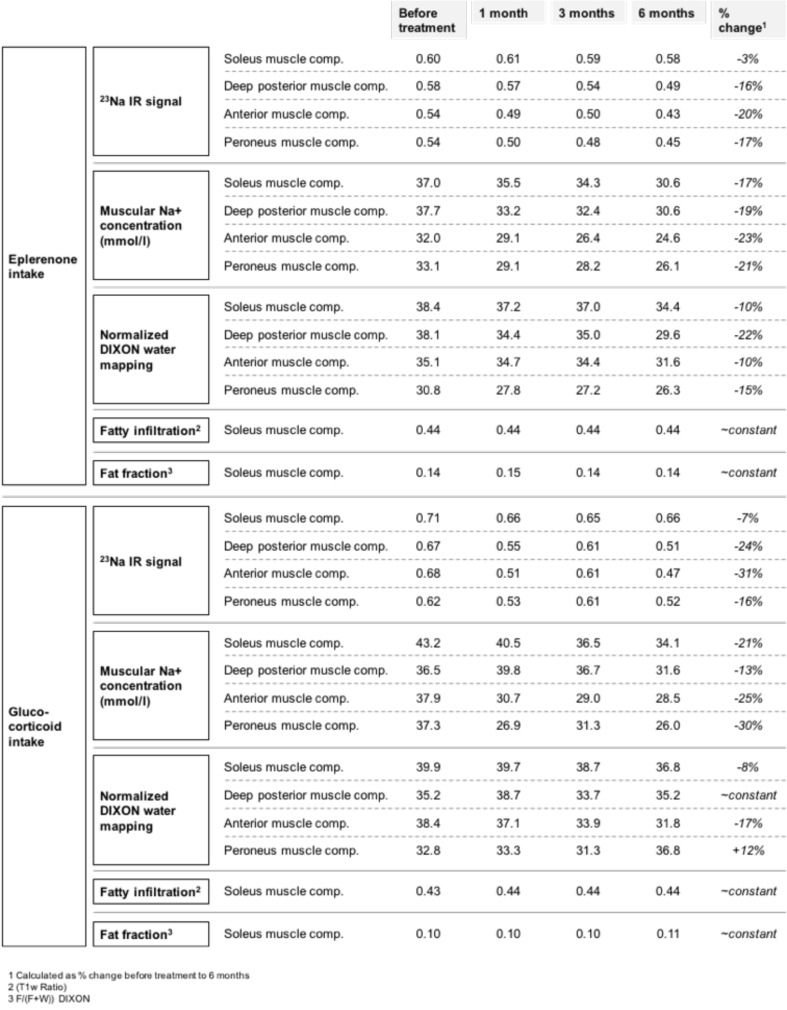
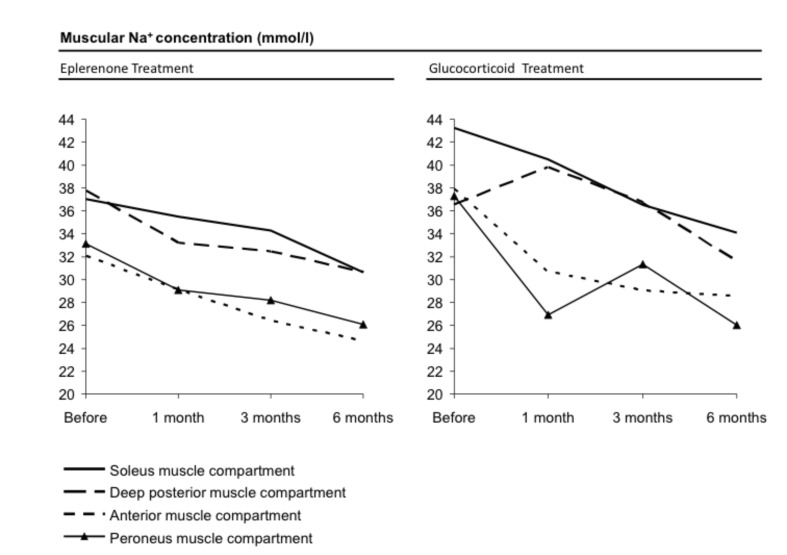
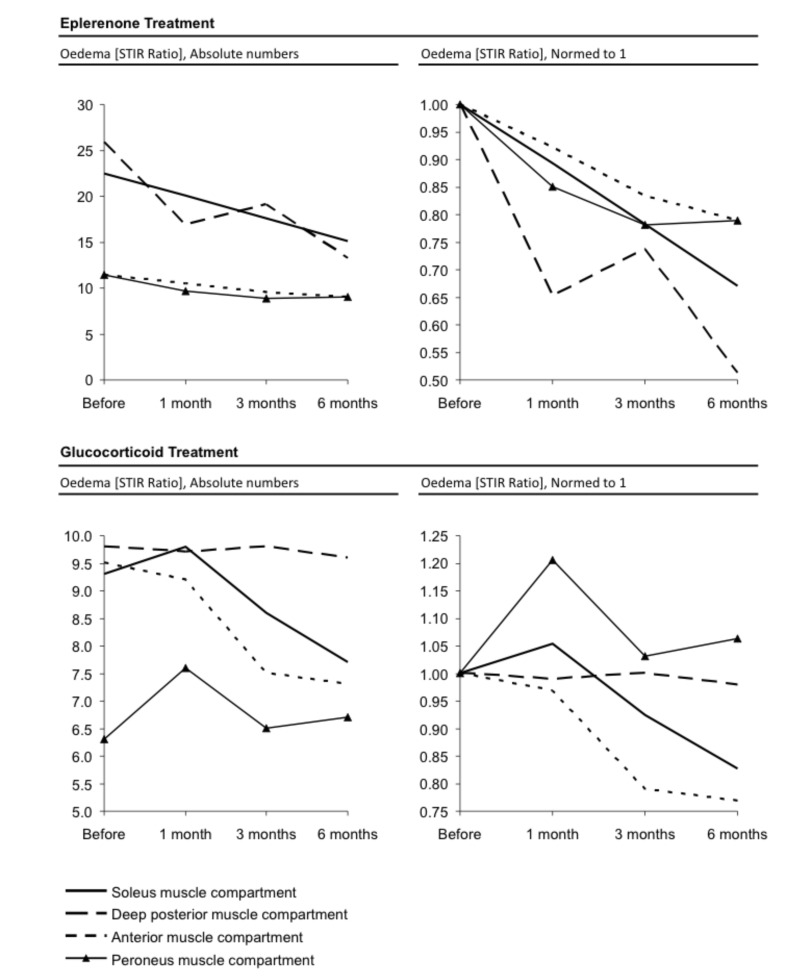
Table 1 shows that 23Na IR was reduced in every muscle compartment after six months of therapy with eplerenone. Correspondingly, the muscular sodium concentration was reduced in every measured compartment, too. The reduction ranged between -17% (soleus muscle compartment) and -23% (anterior muscle compartment) in correlation with the first value before treatment (Fig. 3). The fatty infiltration remained constant with a mean ratio of 0.44 before and after six months of therapy with eplerenone. Equally, the fat fraction measured by the DIXON sequence showed no distinct change with a mean fat fraction of 0.14 and 0.14 six months later. The highest decrease of the STIR ratio was detected in the deep posterior compartment (25.9 before therapy, 13.3 after six months of therapy resulting in a reduction of muscular water content of 48%) followed by the soleus compartment (22.5 before therapy, 15.1 six months after therapy, oedema reduction of 33%). Both the anterior muscle and peronaeus muscle compartment showed both an oedema reduction of 21% (decrease of the STIR ratio from 11.4 to 9 six months after therapy) as mentioned in Figure 4. As depicted in Table 1, the highest decrease of the normalized DIXON water mapping was detected in the deep posterior compartment (38.1 before therapy, 29.6 after six months of therapy resulting in a reduction of muscular water content of 22%) followed by the peronaeus compartment (30.8 before therapy, 26.3 after six months of therapy, reduction of muscular water content of 15%). Both the anterior and the soleus muscle compartment showed an reduction of muscular water content of 10% after six months of therapy.
Table 1.
Treatment effects of two 7-years old DMD boys under eplerenone and glucocorticoid treatment, respectively. There is a decrease of the 23Na IR signal and the muscular sodium concentration following both eplerenone and glucocorticoid treatment. The reduction of muscular water content (measured by the DIXON water mapping) was more pronounced in the boy with eplerenone treatment (especially in deep posterior muscle compartment and peroneus muscle compartment). A slighter change has been found for glucocorticoid treatment. Both the degree of fatty degeneration and the fat fraction (measured within the soleus muscle) remains constant over the 6 months' period.
Figure 3.
Illustration of declining muscular sodium concentration of four different muscle compartments comparing eplerenone vs. cortisone treatment in a graph according to Table 1. Both therapies showed a distinct effect.
Figure 4.
1H STIR Imaging: Illustration of the STIR ratio of four different muscle compartments comparing eplerenone vs. cortisone treatment. Symbols for the respective compartment as given in the legend of the figure. The oedema reduction for the patient following eplerenone treatment showed a higher oedema reduction especially in deep posterior and soleus muscle compartment. A slighter decrease is also shown for the patient receiving cortisone treatment (as showed in figures normed to 1).
Myometry
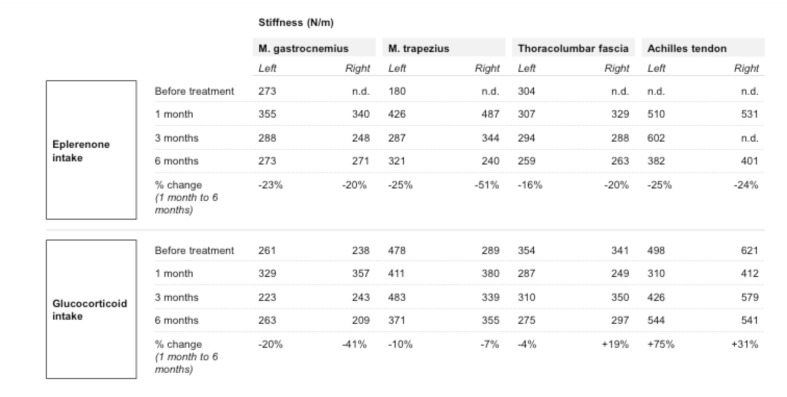
Table 2 illustrates the stiffness measurements at different time points. The boy who received eplerenone medication was first measured before drug administration (approximately one year before drug treatment) at the age of 6, and presented with 273 N/m within the gastrocnemius muscle (left) and 180 N/m within the trapezius muscle (left) an age-typical muscle stiffness at rest. In the following first measurement after eplerenone intake, the stiffness increased drastically to 355 N/m within the gastrocnemius muscle (left) and 426 N/m of the trapezius muscle (left) to values equivalent to those of healthy adults. Three month after eplerenone intake, the muscle stiffness was much lower measured with 288 N/m for the gastrocnemius muscle (left) and 287 N/m for the trapezius muscle (left). Other muscle groups showed the same effect; the deltoideus and the femoralis muscle, for example, showed a reduced stiffness of about 10% (data not shown). After 6 months (at the age of 8 years) of eplerenone intake, the muscle stiffness consolidated. Concerning the stiffness parameters under eplerenone treatment, the viscoelastic properties of the muscles were in a similar range compared to two years before at the age of 6. It is likely that this resembles a reduction of tissue fibrosis after an initial increase of stiffness after starting therapy. For the Achilles tendon and the lumbar fascia on both sides, there was a reduction of stiffness of about 16- 25% measurable (Table 2, change 1 month to six month after therapy). Regarding tendon tissue, we observed a decrease of tissue stiffness corresponding to the results observed within the skeletal muscles.
Table 2.
Illustration of myometry: Myometric changes in stiffness of muscles and tendons were quantitatively assessed as described in the methods' section.
Clinical examination
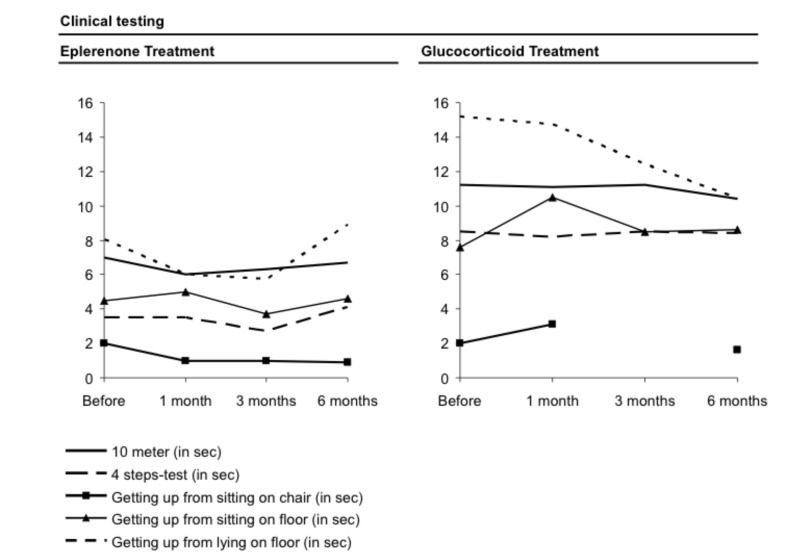
The clinical tests that were part of the clinical protocol for every visit before and under therapy showed no obvious change under therapy (Fig. 5). It can be summarized that no negative clinical effect was observed by the eplerenone treatment, especially no hyperkalaemia. Also, no distinct change in the blood counts or the blood pressure was noted and no abnormal weight increase over time occurred.
Figure 5.
Clinical testing (i.e. walking of 10 meters, 4-steps-test) for evaluation of muscle endurance and muscular abilities following the respective therapy. Both therapies (eplerenone and cortisone) showed no distinct changes in test results over a time-period of six months.
Effect of therapy with glucocorticoids 23Na sodium and 1H MR imaging
Table 1 shows that the 23Na IR signal is reduced in every muscle compartment following six months of therapy; the same effect has been also observed with eplerenone. Correspondingly, muscular sodium concentrations decreased between -13% (deep posterior muscle compartment) and -30% (peroneus muscle compartment) in comparison with the first value before treatment (Fig. 3). The fatty infiltration remains, as also observed with eplerenone treatment, constant with 0.43 before and 0.44 after six months after therapy with glucocorticoids. Moreover, the fat fraction measured by the DIXON sequence showed no distinct change with 0.10 and 0.11 six months later. The STIR ratio was calculated for four different muscle compartments. The highest decrease of 1H STIR ratio was detected in the anterior muscle compartment (9.5 before therapy, 7.3 six months after therapy with glucocorticoids, oedema reduction: 23%) followed by the soleus compartment (9.3 before therapy, 7.7 after six months of therapy, oedema reduction: 17%). Whereas the deep posterior muscle compartment showed only a slight decrease with 2% oedema reduction (9.8 versus 9.6 six months later), the STIR ratio of the peroneus muscle compartment was slightly increased under cortisone treatment (increase: 6%) as mentioned in Figure 4.
As depicted in Table 1, the highest decrease of the normalized DIXON water mapping was detected in the anterior compartment (38.4 before therapy, 31.8 after six months of therapy resulting in a reduction of muscular water content of 17%) followed by the soleus compartment (39.9 before therapy, 36.8 after therapy, reduction of muscular water content of 8%). Whereas the deep posterior muscle compartment showed an undulant pattern with no measurable change after six months of therapy. The normalized DIXON water mapping of the peroneus muscle compartment was slightly increased under cortisone treatment (muscular water content plus 12%).
Myometry
The tissue measurements for the child with glucocorticoid intake varied to some extent between the measuring intervals. The gastrocnemius muscle had a stiffness of 261 N/m on the left and 238N/m on the right side before glucocorticoid intake. After an initial increase of muscle stiffness after starting therapy, the right gastrocnemius muscle showed a stiffness decrease after six months of corticoid therapy (reduction of 20%; change 1 month to six months as mentioned in table 2), the left side showed even a more distinct effect (reduction of 41%, change 1 month to six months) after initial increase. The reduction in stiffness of both trapezius muscles was smaller (10% left and 7% right, change 1 month to six months) after initial increase. For the trapezius muscle we noted at the beginning a remarkable asymmetric stiffness 478 N/m and 289 N/m between the left and the right side probably as a consequence of the progression of the muscle dystrophy. Tendon stiffness showed no initial increase in thoracolumbar fascia and Achilles tendon after starting therapy but varied between a slight decrease (left thoracolumbar fascia, change 1 month to six months -4%) and stiffness increase between +19% and +75% (right thoracolumbar fascia, left Achilles tendon). Of note, the reduced stiffness is still untypically high for children of this age. In summary, we found considerably more heterogeneous data for the boy with glucocorticoid intake.
Clinical examination
No changes of the clinical abilities under cortisone treatment were observed.
Discussion
In our pilot study, two 7-years old children were monitored (23Na and 1H MRI, myometry, clinical tests, blood counts for the child treated with eplerenone) under treatment with eplerenone, respectively, cortisone for a time period of six months after starting therapy. In both patients we detected a reduction of muscular oedema, intracellular-weighted sodium IR signal and muscular sodium concentration (Fig. 3). The oedema reduction in the DMD patient under eplerenone treatment was more pronounced than the reduction observed in the DMD patient under glucocorticoid treatment (in due consideration of oedema reduction, Figs. 2 and 4 and Table 1). Similarly, myometric-measured tissue parameters such as muscle stiffness had a more pronounced effect in the child treated with eplerenone. Clinical abilities of both children during therapy were mostly constant.
It is common practice to start a drug therapy (the current gold standard is cortisone despite adverse effects like osteoporosis, weight increase and corticoid myopathy) when first clinical and motoric limitations appear. Unfortunately, at this timepoint, oedema-induced cytotoxic and consecutive fibrotic tissue remodelling of DMD muscle or brain cells already have taken place. Hirn et al. showed that deregulation of voltage gated NaV1.4 channels in dystrophic muscle cells of mdx mice led to massive influx of sodium in the cytoplasmatic compartment and consequently cell death. The effect could be reversed by a specific blocking of NaV1.4 channels with tetrodotoxin (9). Even more, the nNOS (neuronal nitric oxide synthases, catalyze the production of NO from L-Arginin) signalling pathway as a modifier of dystrophic pathology seems to play a major role in Duchenne muscular dystrophy. Froehner et al. showed that in DMD nNOSβ and nNOSμ are mislocalized, less expressed and, thus, less functional (10). Impaired NO-triggered vasodilation of affected muscles could lead to a worse blood perfusion and, finally, to degeneration of muscle (11). Zhou et al. (12) demonstrated that a lack of NOS in cardiac muscle cells didn't interrupt the protein expression of Na+/ K+-ATPase and Ca2+-ATPase, but significantly altered activity and, therefore, function of both above-mentioned ATPases leading to a cellular sodium disequilibrium.
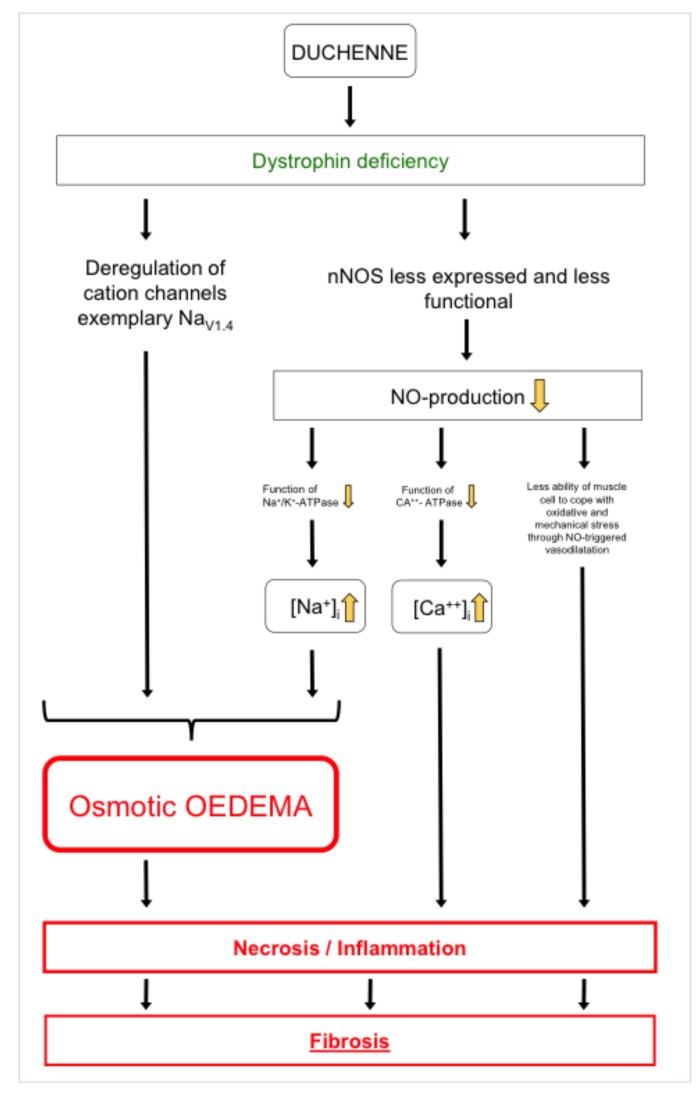
In this context, a new paradigm for pathogenetic mechanisms in Duchenne was shaped in focus of a osmotic cytoplasmic sodium elevation causing intracellular and mainly osmotic muscular oedema (2, 3). Therefore, lowering the overall sodium concentration in the body by a mild diuretic substance could be a reasonable approach to diminish the pathogenic effect. An anti-oedematous effect of cortisone was detected and described previously (2). In a severe case of Duchenne, a 22-years old woman benefits remarkably from eplerenone treatment and gained mobility again (1). Regarding the heart, eplerenone application showed positive effects in preservation of ejection fraction and left ventricular systolic function (6). Requisite for the development of early starting therapy concepts is an adequate measurement technique to quantify tissue quality. In our preliminary study, this was already possible at the age of 7 years. We could verify tissue improvements in our pilot study under drug therapy (eplerenone and cortisone). DMD children without treatment showed increased muscular oedema and fatty degeneration over time. Fatty degeneration using 1H T1-weighted and DIXON sequences capped equal in a 6 month's period under drug treatment. On the cellular level the lack of dystrophin leads to a reduced mechanotransduction and major signalling pathways (nNOS) and causes an increase of oxidative stress levels. Under mechanical stress cations mainly Ca2+ and Na+ can enter the cell. This intracellular increase of sodium leads to an osmotic pressure that results in oedema formation that we detected in 1H STIR imaging and reconfirmed in the DIXON water mapping. Ca2+ influx, even to a small extent, does change calcium modulated several signalling pathways leading for example to apoptotic degeneration (13) (Fig. 6). In the end, massive oxidative stress leads to cell necrosis (14). Therefore, antiinflammatory nutrition may have an beneficial antidegenerative effect in DMD (15). In this context, the role of utrophin as a dystrophin homologue and as a scaffolding protein that stabilizes lipid microdomains and clusters channel subunits may be considered. Compensatory upregulation of utrophin in mdx mice only leads to mild forms of Duchenne muscular dystrophy (16). Fibrosis goes along with stiffening of tissue (muscle, tendon, connective tissue) and is characterized by massive deposition of collagen in the extracellular matrix (17). Transforming growth factor ß1 is one component that induces the differentiation of fibroblasts into collagen-producing myofibroblasts, the major collagen-producing cells of the extracellular matrix (18). We assume that the measured stiffness reduction upon eplerenone treatment is due to reduction of fibrosis. Concerning the stiffness parameters under eplerenone treatment, the viscoelastic properties of the muscles were in a similar range as two years before at the age of 6. It is likely that this resembles a reduction of tissue fibrosis after an initial increase in stiffness after starting therapy. The tissue measurements for the child with glucocorticoid intake vary to some extent between the measuring intervals and showed slightly more heterogeneous data (change 1 month to six months after starting therapy) between decrease (muscles, left thoracolumbar fascia) and increase (right thoracolumbar fascia, Achilles tendon). This can be due to a different degree of Duchenne pathology, medication or even tissue type susceptibility, like it is found for hypermobile individuals. For the child under eplerenone application, we noted a reduction in tissue stiffness between 20% and 51% for skeletal muscles and 16% and 25% for tendons (change 1 month to six months after therapy). Van den Hoorn et al. showed pain effects on gait stability underlining the biomechanical importance of reducing hypertrophy of calf muscles in early stages of DMD patients (19).
Figure 6.
Model illustrating the presumed pathophysiology in Duchenne muscular dystrophy. Dystrophin deficiency, nNOS and consecutive inaccurate sodium homeostasis as a major contributor in Duchenne muscular dystrophy.
The clinical testing showed no clear tendency in our pilot study (Fig. 5). This could be due to the fact that a six month's period was too short to show clinical manifestations or would have needed more extensive testing, for instance testing for changes of endurance at this stage of DMD manifestation. The low level eplerenone medication had no influence of the blood potassium level. For preclinical and clinical studies, sodium (23Na) MRI and myometry may have the potential to serve as adequate techniques for evaluating especially early stages of Duchenne muscular dystrophy. In clinical practice, it may be helpful in case clinicians could assess a tissue fibrotic status in different parts of the body without having to perform time-consuming measurements such as blood analysis or tissue histology or without the option for MRI analysis.
In conclusion, according to our data we observed in our patient treated with eplerenone a cortisone-comparable tissue effect over 6 months of medication on MRI and myometry. Therefore, further trials with larger patient numbers need to demonstrate whether (in the long term) eplerenone should be regarded as a possible new therapy option in DMD patients.
Acknowledgements
This study was supported by the Benni & Co. Foundation for Duchenne Disease (to Prof. Frank Lehmann- Horn and PD Dr. Karin Jurkat-Rott), the Eva Luise Köhler Foundation (to Prof. Marc-André Weber and PD Dr. Karin Jurkat-Rott), and the non-profit Hertie Foundation (to Prof. Frank Lehmann-Horn).
The analyses of molecular genetics of the patient treated with eplerenone (hemizygous deletion of exons 45-50 of gene encoding dystrophin) and the patient treated with glucocorticoids (duplication of exons 20-22 of gene encoding dystrophin) were performed by Institute of Human Genetics, University Hospital, Würzburg/Germany). We are grateful to the patients and their families for their participation.
References
- 1.Lehmann-Horn F, Weber MA, Nagel AM, et al. Rationale for treating oedema in Duchenne muscular dystrophy with eplerenone. Acta Myol. 2012;31:31–39. [PMC free article] [PubMed] [Google Scholar]
- 2.Weber MA, Nagel AM, Jurkat-Rott K, et al. Sodium (23Na) MRI detects elevated muscular sodium concentration in Duchenne muscular dystrophy. Neurology. 2011;77:2017–2024. doi: 10.1212/WNL.0b013e31823b9c78. [DOI] [PubMed] [Google Scholar]
- 3.Weber MA, Nagel AM, Wolf MB, et al. Permanent muscular sodium overload and persistent muscle edema in Duchenne muscular dystrophy: a possible contributor of progressive muscle degeneration. J Neurol. 2012;259:2385–2392. doi: 10.1007/s00415-012-6512-8. [DOI] [PubMed] [Google Scholar]
- 4.Carberry S, Zweyer M, Swandulla D, et al. Proteomics reveals drastic increase of extracellular matrix proteins collagen and dermatopontin in the aged mdx diaphragm model of Duchenne muscular dystrophy. Int J Mol Med. 2012;30:229–234. doi: 10.3892/ijmm.2012.1006. [DOI] [PMC free article] [PubMed] [Google Scholar]
- 5.Nehme J, Mercier N, Labat C, et al. Differences between cardiac and arterial fibrosis and stiffness in aldosterone-salt rats: effect of eplerenone. J Renin Angiotensin Aldosterone Syst. 2006;7:31–39. doi: 10.3317/jraas.2006.004. [DOI] [PubMed] [Google Scholar]
- 6.Raman SV, Hor KN, Mazur W, et al. Eplerenone for early cardiomyopathy in Duchenne muscular dystrophy: a randomised, doubleblind, placebo-controlled trial. Lancet Neurol. 2015;14:153–161. doi: 10.1016/S1474-4422(14)70318-7. Erratum in: Lancet Neurol 2015;14:135. [DOI] [PMC free article] [PubMed] [Google Scholar]
- 7.Nagel AM, Laun FB, Weber MA, et al. Sodium MRI using a density- adapted 3D radial acquisition technique. Magn Reson Med. 2009;62:1565–1573. doi: 10.1002/mrm.22157. [DOI] [PubMed] [Google Scholar]
- 8.Nagel AM, Amarteifio E, Lehmann-Horn F, et al. 3 Tesla sodium inversion recovery magnetic resonance imaging allows for improved visualization of intracellular sodium content changes in muscular channelopathies. Invest Radiol. 2011;46:759–766. doi: 10.1097/RLI.0b013e31822836f6. [DOI] [PubMed] [Google Scholar]
- 9.Hirn C, Shapovalov G, Petermann O, et al. Nav1.4 deregulation in dystrophic skeletal muscle leads to Na+ overload and enhanced cell death. J Gen Physiol. 2008;132:199–208. doi: 10.1085/jgp.200810024. [DOI] [PMC free article] [PubMed] [Google Scholar]
- 10.Froehner SC, Reed SM, Anderson KN, et al. Loss of nNOS inhibits compensatory muscle hypertrophy and exacerbates inflammation and eccentric contraction-induced damage in mdx mice. Hum Mol Genet. 2015;24:492–505. doi: 10.1093/hmg/ddu469. [DOI] [PMC free article] [PubMed] [Google Scholar]
- 11.Sato K, Yokota T, Ichioka S, et al. Vasodilation of intramuscular arterioles under shear stress in dystrophin-deficient skeletal muscle is impaired through decreased nNOS expression. Acta Myol. 2008;27:30–36. [PMC free article] [PubMed] [Google Scholar]
- 12.Zhou L, Burnett AL, Huang PL, et al. Lack of nitric oxide synthase depresses ion transporting enzyme function in cardiac muscle. Biochem Biophys Res Commun. 2002;294:1030–1035. doi: 10.1016/S0006-291X(02)00599-5. [DOI] [PubMed] [Google Scholar]
- 13.Turner PR, Fong PY, Denetclaw WF, et al. Increased calcium influx in dystrophic muscle. J Cell Biol. 1991;115:1701–1712. doi: 10.1083/jcb.115.6.1701. [DOI] [PMC free article] [PubMed] [Google Scholar]
- 14.Barros LF, Stutzin A, Calixto A, et al. Nonselective cation channels as effectors of free radical-induced rat liver cell necrosis. Hepatology. 2001;33:114–122. doi: 10.1053/jhep.2001.20530. [DOI] [PubMed] [Google Scholar]
- 15.Davis J, Samuels E, Mullins L, et al. Nutrition considerations in Duchenne Muscular Dystrophy. Nutr Clin Pract. 2015;30:511–521. doi: 10.1177/0884533615586202. [DOI] [PubMed] [Google Scholar]
- 16.Tan N, Lansman JB. Utrophin regulates modal gating of mechanosensitive ion channels in dystrophic skeletal muscle. J Physiol. 2014;592(Pt 15):3303–3323. doi: 10.1113/jphysiol.2014.274332. [DOI] [PMC free article] [PubMed] [Google Scholar]
- 17.Duance VC, Stephens HR, Dunn M, et al. A role for collagen in the pathogenesis of muscular dystrophy? Nature. 1980;284:470–472. doi: 10.1038/284470a0. [DOI] [PubMed] [Google Scholar]
- 18.Bernasconi P, Torchiana E, Confalonieri P, et al. Expression of transforming growth factor-beta 1 in dystrophic patient muscles correlates with fibrosis. Pathogenetic role of a fibrogenic cytokine. J Clin Invest. 1995;96:1137–1144. doi: 10.1172/JCI118101. [DOI] [PMC free article] [PubMed] [Google Scholar]
- 19.Hoorn W, Hug F, Hodges PW, et al. Effects of noxious stimulation to the back or calf muscles on gait stability. J Biomech. 2015;48:4109–4115. doi: 10.1016/j.jbiomech.2015.10.013. [DOI] [PubMed] [Google Scholar]


