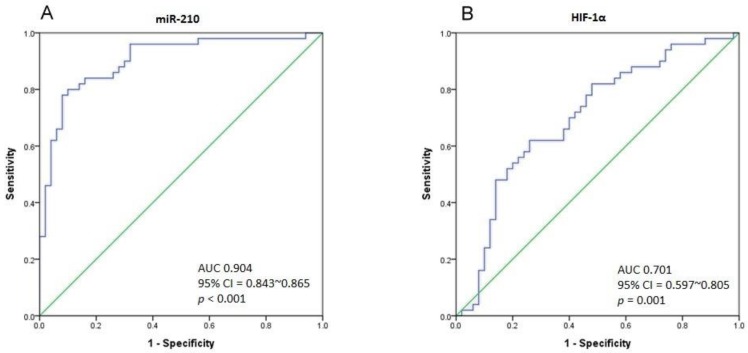
Figure 3.
(A) The ROC curve analysis for miR-210 expression to calculate the best cut-off point that discriminates between UTUC and non-cancerous urothelium. The area under curve (AUC) is 0.904 (95% CI = 0.843-0.865, p < 0.001). (B) The ROC curve analysis for HIF-1α expression. The AUC is 0.701 (95% CI = 0.597-0.805, p = 0.001).

