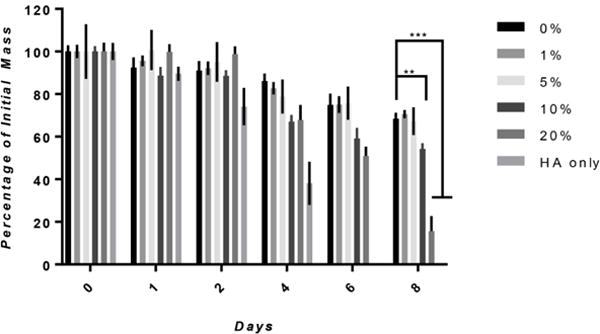
Figure 6. In vitro Degradation.

Degradation was determined by calculating the fraction of initial mass after soaking in an enzymatic cocktail consisting of 1 U/mL and 0.001 U/mL of hyalruonidase and protease. A direct relation between degradation rate and HA concentration was seen when increasing HA concentration above 5% significantly increased the degradation rate at day 8 (n=4, **p≤0.01, ***p≤0.001).
