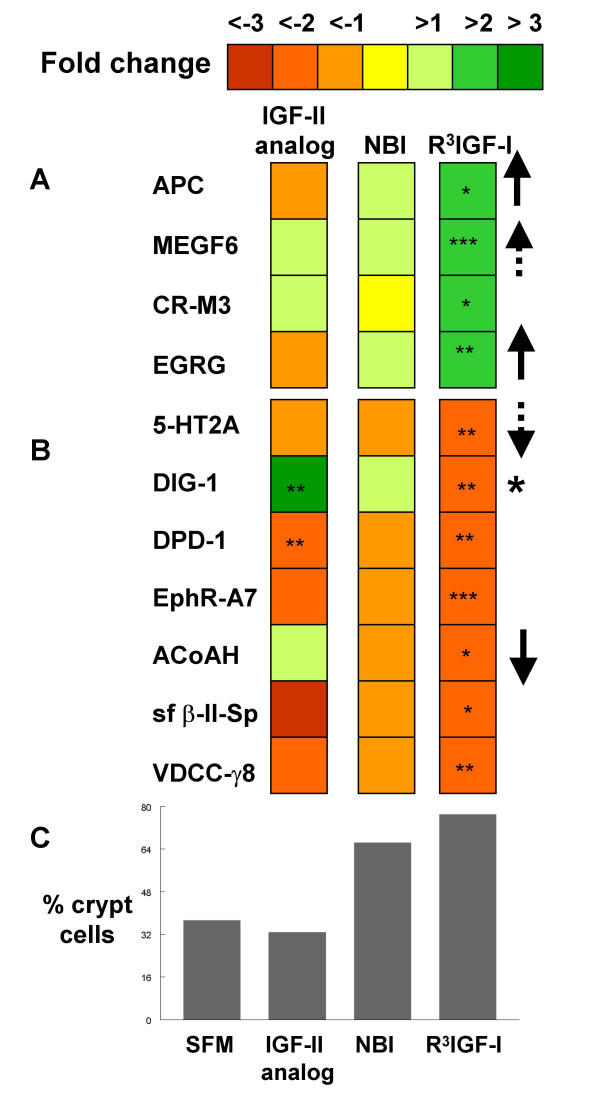
Figure 3.
Gene array screen using skewed IEC-18 cell composition to find potential phenotypic markers. Affymetrix rat gene chips were used to compare RNA from SFM and R3-IGF-I treated cells to find individual genes with significant fold changes – defined as greater than two fold more (A) or two fold less (B) with a p-value of less than 0.1 for the purpose of this screen. These were then compared with the fold changes from IGF-II analog and NBI 31772 to look for fold change trends that paralleled the changing cell composition (summarized in C as the percentage of crypt cells). The results are presented as upward arrows (strong positive correlations), upward dashed arrows (weak positive correlations), downward arrows (strong inverse correlations) and downward dashed arrows (weak inverse correlations). The large asterisk points to an example where both direct receptor agonists resulted in a significant difference but NBI 31772 did not, suggesting a direct drug effect rather than an effect of cell composition – making this gene a less likely candidate. For smaller asterisks, *** = p < 0.01, ** = p < 0.05, and * = p < 0.1.

